As we have already discussed the meaning of depreciation in the previous article now in this article we will explain to you the first method of calculating the amount of depreciation named the Straight Line Method of depreciation.
Straight Line Method: –
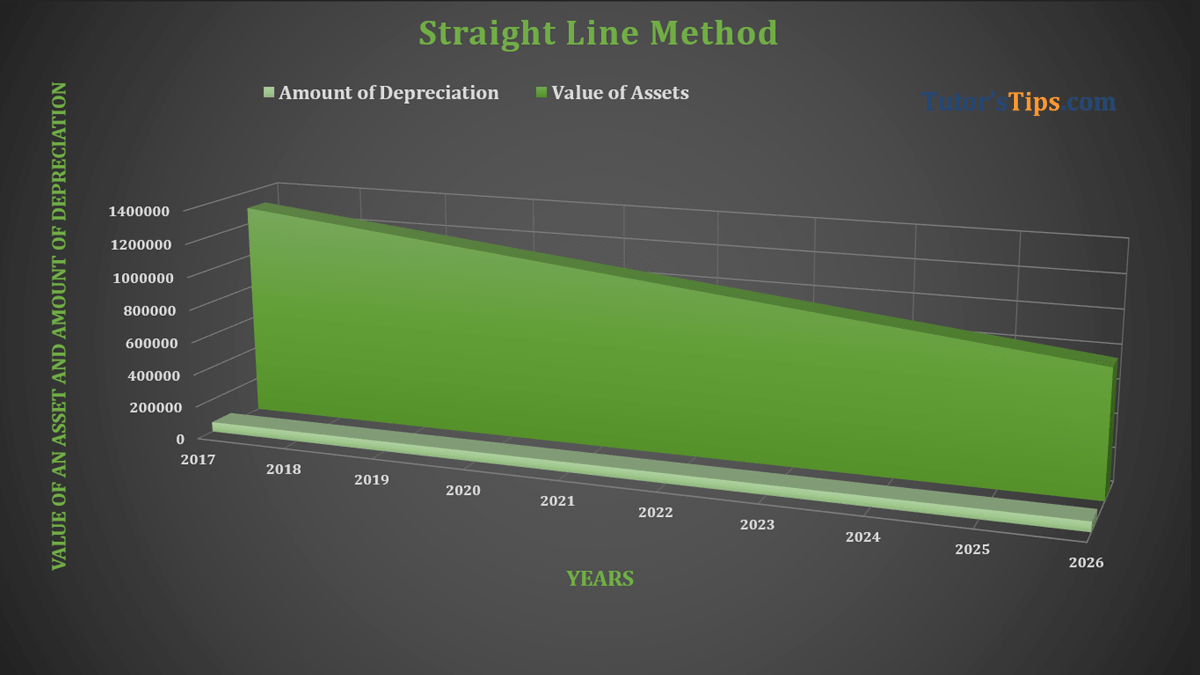
In Straight Line Method, we calculate the fixed amount of depreciation on the original cost of an asset and charge until the book value of an asset will equal to zero or its scrap value. It is also called the original cost method and fixed installment method. This method is suitable for intangible assets like patent, copyright, and trademarks etc.
Formula of Depreciation: –
The Depreciation can be calculated under the Straight Line Method of Depreciation with the help of following formula:

Total Cost of an asset includes money spent on the purchase of it and to convert it into working condition like installation charges, transportation charges, and first time oiling etc.
Example: On 01/04/2017 Machinery purchased for Rs 11,00,000/- and paid for transportation charge 1,50,000/- to transport the machine in our plant and paid installation charges also paid for Rs 50,000/-. Scrap value will be Rs 1,00,000/- and the useful life of machinery is 20 year. Year ending 31 March. Charge depreciation with the Straight Line Method of depreciation.
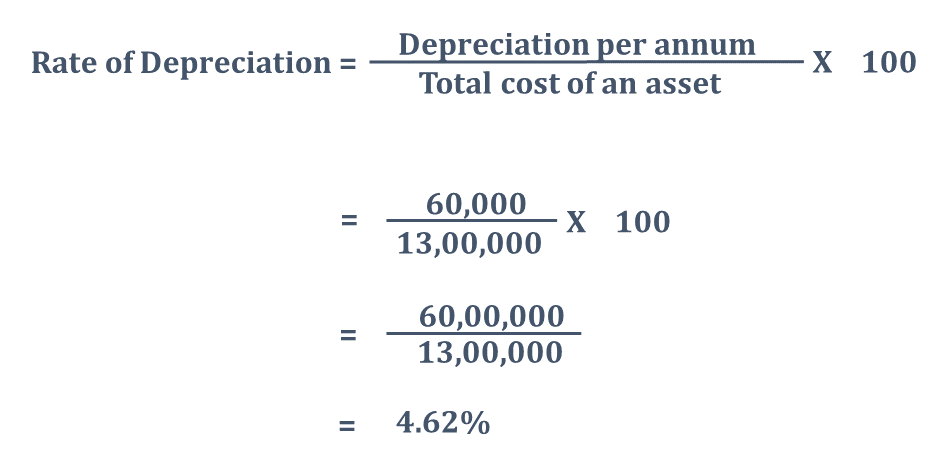
So, Total Cost of an asset = 11,00,000+1,50,000+50,000
=Rs 13,00,000/-

We can also calculate the rate of depreciation with the following formula:
The journal entries under the Straight Line Method: –
How to post journal entries under the Straight Line Method of Depreciation shown below:
In the First Years: –
1) 01/04/18 Machinery A/c Dr. 11,00,000
To Bank A/c 11,00,000
(Being machinery purchased)
2) 01/04/18 Machinery A/c Dr. 1,50,000
To Bank A/c 1,50,000
(Being transport charges paid on the purchase of machinery )
3) 01/04/18 Machinery A/c Dr. 50,000
To Bank A/c 50,000
(Being Installation charges paid on the purchase of machinery )
4) 31/03/18 Depreciation A/c Dr. 60,000
To Machinery A/c 60,000
(Being Depreciation charged on the machine )
4) 31/03/18 Profit and Loss A/c Dr. 60,000
To Depreciation A/c 60,000
(Being Depreciation on machine transfer to P/L A/c)
*Note: We can post all payment transactions together if they are taking please on same date and payment is made to the single person.
In Subsequent Years: –
We will post only transactions 3 & 4 transactions at the end of each subsequent year until the value of an asset become zero or equal to scrap value. and when we sold out this asset.
We also have to post-opening & closing assets and liabilities entry in the books.
The Asset account under the Straight Line Method: –
Now we will prepare an asset account under the Straight Line Method of Depreciation shown below:
| Machinery Account | |||||
| Date | Particulars | Amount | Date | Particulars | Amount |
| 01-04-17 | To Bank A/c | 11,00,000 | 31-03-18 | By Depreciation A/c | 60,000 |
| 01-04-17 | To Bank A/c (Transportation) |
1,50,000 | 31-03-18 | By Balance C/d (Balancing Fig) |
12,40,000 |
| 01-04-17 | To Bank A/c (Installation) |
50,000 | |||
| 13,00,000 | 13,00,000 | ||||
| 01-04-18 | To Balance B/d | 12,40,000 | 31-03-19 | By Depreciation A/c | 60,000 |
| 31-03-19 | By Balance C/d (Balancing Fig) |
11,80,000 | |||
| 12,40,000 | 12,40,000 | ||||
| 01-04-19 | To Balance B/d | 11,80,000 | 31-03-20 | By Depreciation A/c | 60,000 |
| 31-03-20 | By Balance C/d (Balancing Fig) |
11,20,000 | |||
| 11,80,000 | 11,80,000 | ||||
| 01-04-20 | To Balance B/d | 11,20,000 | 31-03-21 | By Depreciation A/c | 60,000 |
| 31-03-21 | By Balance C/d (Balancing Fig) |
10,60,000 | |||
| 11,20,000 | 11,20,000 | ||||
| 01-04-21 | To Balance B/d | 10,60,000 | 31-03-22 | By Depreciation A/c | 60,000 |
| 31-03-22 | By Balance C/d (Balancing Fig) |
10,00,000 | |||
| 10,60,000 | 10,60,000 | ||||
| 01-04-22 | To Balance B/d | 10,00,000 | 31-03-23 | By Depreciation A/c | 60,000 |
| 31-03-23 | By Balance C/d (Balancing Fig) |
9,40,000 | |||
| 10,00,000 | 10,00,000 | ||||
| So on………………… | |||||
The table of depreciation charged under Straight Line Method.
The following table shows the year by year depreciation charged under Straight Line Method.
| Year ended | Opening balance of an asset | Amount of depreciation | The closing balance of an asset |
| 31-03-2017 | 13,00,000 | 60,000 | 12,40,000 |
| 31-03-2018 | 12,40,000 | 60,000 | 11,80,000 |
| 31-03-2019 | 11,80,000 | 60,000 | 11,20,000 |
| 31-03-2020 | 11,20,000 | 60,000 | 10,60,000 |
| 31-03-2021 | 10,60,000 | 60,000 | 10,00,000 |
| 31-03-2022 | 10,00,000 | 60,000 | 9,40,000 |
| 31-03-2023 | 9,40,000 | 60,000 | 8,80,000 |
| 31-03-2024 | 8,80,000 | 60,000 | 8,20,000 |
| 31-03-2025 | 8,20,000 | 60,000 | 7,60,000 |
| 31-03-2026 | 7,60,000 | 60,000 | 7,00,000 |
| 31-03-2027 | 7,00,000 | 60,000 | 6,40,000 |
| 31-03-2028 | 6,40,000 | 60,000 | 5,80,000 |
| 31-03-2029 | 5,80,000 | 60,000 | 5,20,000 |
| 31-03-2030 | 5,20,000 | 60,000 | 4,60,000 |
| 31-03-2031 | 4,60,000 | 60,000 | 4,00,000 |
| 31-03-2032 | 4,00,000 | 60,000 | 3,40,000 |
| 31-03-2033 | 3,40,000 | 60,000 | 2,80,000 |
| 31-03-2034 | 2,80,000 | 60,000 | 2,20,000 |
| 31-03-2035 | 2,20,000 | 60,000 | 1,60,000 |
| 31-03-2036 | 1,60,000 | 60,000 | 1,00,000 |