As we have already discussed the meaning of depreciation in the previous article now in this article we will explain to you the second method of calculating the amount of depreciation named the Diminishing Balance Method of Depreciation.
What is Diminishing Balance Method of Depreciation:
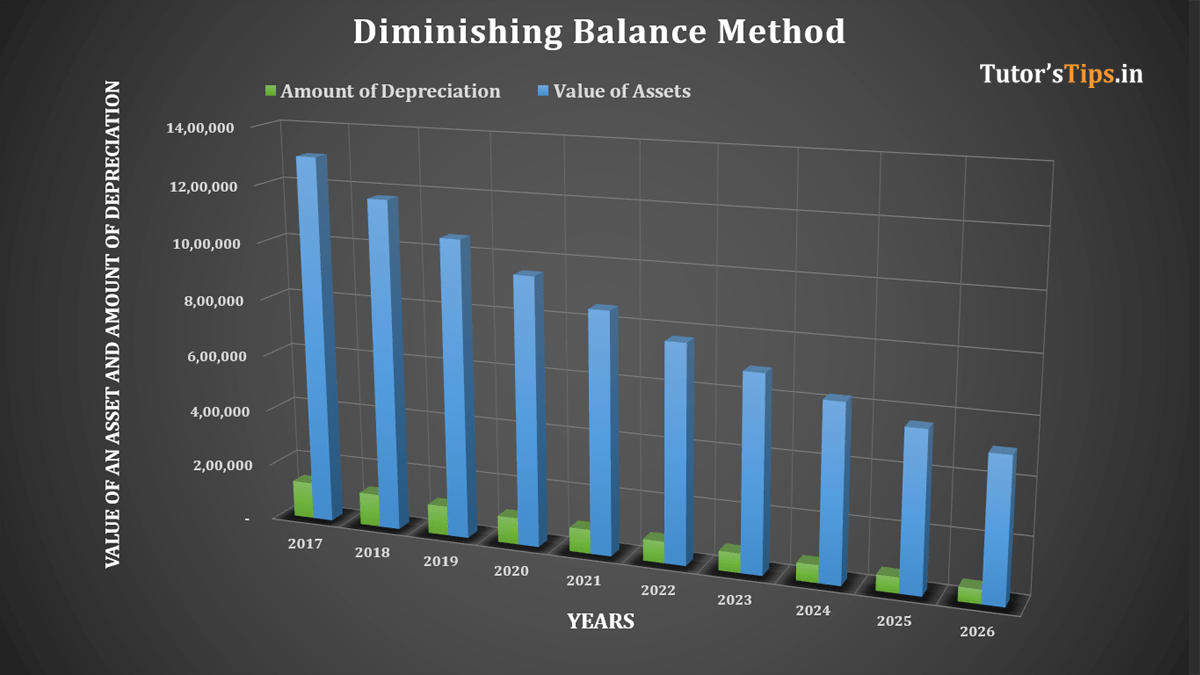
In Diminishing Balance method of Depreciation, we have calculated the depreciation on the closing value of an asset and charge until the book value of an asset will equal to its scrap value. The amount of depreciation will be diminished or decreased as compared to last year because we charge the fixed rate of depreciation on the closing value of an asset. It is also called written down value and reducing value method. This method is suitable for tangible assets like Building, plant & machinery and furniture & fixture etc.
Formula of Depreciation: –
The Depreciation can be calculated under this method with the help of following formula:

Total Cost of an asset includes money spent on the purchase of it and to convert it into working condition like installation charges, transportation charges, and first time oiling etc.
Example of Diminishing Balance Method of Depreciation:
On 01/04/2017 Machinery purchased for Rs 11,00,000/- and paid for transportation charge 1,50,000/- to install the machine in our plant and paid installation charges also for Rs 50,000/-. The rate of Depreciation @ 10% Year ending 31 March.
So, Total Cost of an asset = 11,00,000+1,50,000+50,000
= Rs 13,00,000/-
The following table shows the year by year depreciation charged under Diminishing Balance Method.
| Year ended | Opening balance of an asset | Amount of depreciation | The closing balance of an asset |
| 31-03-2017 | 13,00,000 | 1,30,000 | 11,70,000 |
| 31-03-2018 | 11,70,000 | 1,17,000 | 10,53,000 |
| 31-03-2019 | 10,53,000 | 1,05,300 | 9,47,700 |
| 31-03-2020 | 9,47,700 | 94,770 | 8,52,930 |
| 31-03-2021 | 8,52,930 | 85,293 | 7,67,637 |
| 31-03-2022 | 7,67,637 | 76,764 | 6,90,873 |
| 31-03-2023 | 6,90,873 | 69,087 | 6,21,786 |
| 31-03-2024 | 6,21,786 | 62,179 | 5,59,607 |
| 31-03-2025 | 5,59,607 | 55,961 | 5,03,647 |
| 31-03-2026 | 5,03,647 | 50,365 | 4,53,282 |
| 31-03-2027 | 4,53,282 | 45,328 | 4,07,954 |
| 31-03-2028 | 4,07,954 | 40,795 | 3,67,158 |
| 31-03-2029 | 3,67,158 | 36,716 | 3,30,443 |
| 31-03-2030 | 3,30,443 | 33,044 | 2,97,398 |
| 31-03-2031 | 2,97,398 | 29,740 | 2,67,658 |
| 31-03-2032 | 2,67,658 | 26,766 | 2,40,893 |
| 31-03-2033 | 2,40,893 | 24,089 | 2,16,803 |
| 31-03-2034 | 2,16,803 | 21,680 | 1,95,123 |
| 31-03-2035 | 1,95,123 | 19,512 | 1,75,611 |
| 31-03-2036 | 1,75,611 | 17,561 | 1,58,050 |
| 31-03-2037 | 1,58,050 | 15,805 | 1,42,245 |
| 31-03-2038 | 1,42,245 | 14,224 | 1,28,020 |
| 31-03-2039 | 1,28,020 | 12,802 | 1,15,218 |
| 31-03-2040 | 1,15,218 | 11,522 | 1,03,696 |
| 31-03-2041 | 1,03,696 | 10,370 | 93,327 |
Now, we will post all the journal entries year by year as follows: –
| Date | Particulars | L.F. | Debit | Credit | ||
| 1st Year | ||||||
| 2016-17 | ||||||
| 01-Apr | Machinery A/c | Dr. | 13,00,000 | |||
| To Bank A/c | 13,00,000 | |||||
| (Being land purchased on lease ) | ||||||
| 31-Mar | Depreciation A/c | Dr. | 1,30,000 | |||
| To Machinery A/c | 1,30,000 | |||||
| (Being Depreciation on asset charged) | ||||||
| 31-Mar | Profit or loss A/c | Dr. | 1,30,000 | |||
| To Depreciation A/c | 1,30,000 | |||||
| (Being Depreciation transfer to P&L A/c) | ||||||
| 2nd Year | ||||||
| 2017-18 | ||||||
| 31-Mar | Depreciation A/c | Dr. | 1,17,000 | |||
| To Machinery A/c | 1,17,000 | |||||
| (Being Depreciation on asset charged) | ||||||
| 31-Mar | Profit or loss A/c | Dr. | 1,17,000 | |||
| To Depreciation A/c | 1,17,000 | |||||
| (Being Depreciation transfer to P&L A/c) | ||||||
| Subsequent Years | ||||||
| 2017-18 | ||||||
| 31-Mar | Depreciation A/c | Dr. | _______ | |||
| To Machinery A/c | _______ | |||||
| (Being Depreciation on asset charged) | ||||||
| 31-Mar | Profit or loss A/c | Dr. | _______ | |||
| To Depreciation A/c | _______ | |||||
| (Being Depreciation transfer to P&L A/c) | ||||||
| Note: – | Journal Entries will be the same for all subsequent years but the only amount of depreciation will be changed as calculated in the above table | |||||
| Machinery Account | |||||
| Date | Particulars | Amount | Date | Particulars | Amount |
| 01-04-2017 | To Bank A/c | 11,00,000 | 31-03-2018 | By Depreciation A/c | 1,30,000 |
| 01-04-2017 | To Bank A/c | 1,50,000 | 31-03-2018 | By Balance C/d | 11,70,000 |
| (Transportation) | (Balancing Fig) | ||||
| 01-04-2017 | To Bank A/c | 50,000 | |||
| (Installation) | |||||
| 13,00,000 | 13,00,000 | ||||
| 01-04-2018 | To Balance B/d | 11,70,000 | 31-03-2019 | By Depreciation A/c | 1,17,000 |
| 31-03-2019 | By Balance C/d | 10,53,000 | |||
| (Balancing Fig) | |||||
| 11,70,000 | 11,70,000 | ||||
| 01-04-2019 | To Balance B/d | 10,53,000 | 31-03-2020 | By Depreciation A/c | 1,05,300 |
| 31-03-2020 | By Balance C/d | 9,47,700 | |||
| (Balancing Fig) | |||||
| 10,53,000 | 10,53,000 | ||||
| 01-04-2020 | To Balance B/d | 9,47,700 | 31-03-2021 | By Depreciation A/c | 94,770 |
| 31-03-2021 | By Balance C/d | 8,52,930 | |||
| (Balancing Fig) | |||||
| 9,47,700 | 9,47,700 | ||||
| 01-04-2020 | To Balance B/d | 8,52,930 | 31-03-2021 | By Depreciation A/c | 85,293 |
| 31-03-2021 | By Balance C/d | 7,67,637 | |||
| (Balancing Fig) | |||||
| 8,52,930 | 8,52,930 | ||||
| same entries will be posted till the value of asset become zero or equal to scrap value | |||||
Thanks for reading the topic of the Diminishing Balance Method of Depreciation, please comment with your feedback whatever you want.
Or
If you have any questions please ask us by commenting.
 This topic is also available in Hindi. Click Here