Relationship between average marginal and total cost defines how these terms are interlinked with each other.
Relationship between AC, MC and TC:
The relationship between these terms explains how these costs are related to each other. We can understand this relationship by :
(I)Relationship between average and marginal cost
(II) Relationship between total cost and marginal cost
Relationship between average and marginal cost:
It explains how the average and marginal costs are related to each other at different levels of output. It can easily be understood with tabular and graphical representation:
Representation:
| Output (in units) | Total Cost (Rs.) | Average Cost (Rs) | Marginal Cost (Rs) |
| 0 | 20 | ∞ | – |
| 1 | 40 | 40 | 20 |
| 2 | 56 | 28 | 16 |
| 3 | 69 | 23 | 13 |
| 4 | 80 | 20 | 11 |
| 5 | 90 | 18 | 10 |
| 6 | 102 | 17 | 12 |
| 7 | 126 | 18 | 24 |
The above table shows how AC and MC react with respect to each other. It can be shown graphically :

In fig, X-axis shows the output and Y-axis shows the cost. MC and AC curves are Marginal cost and Average cost curves respectively.
Observations:
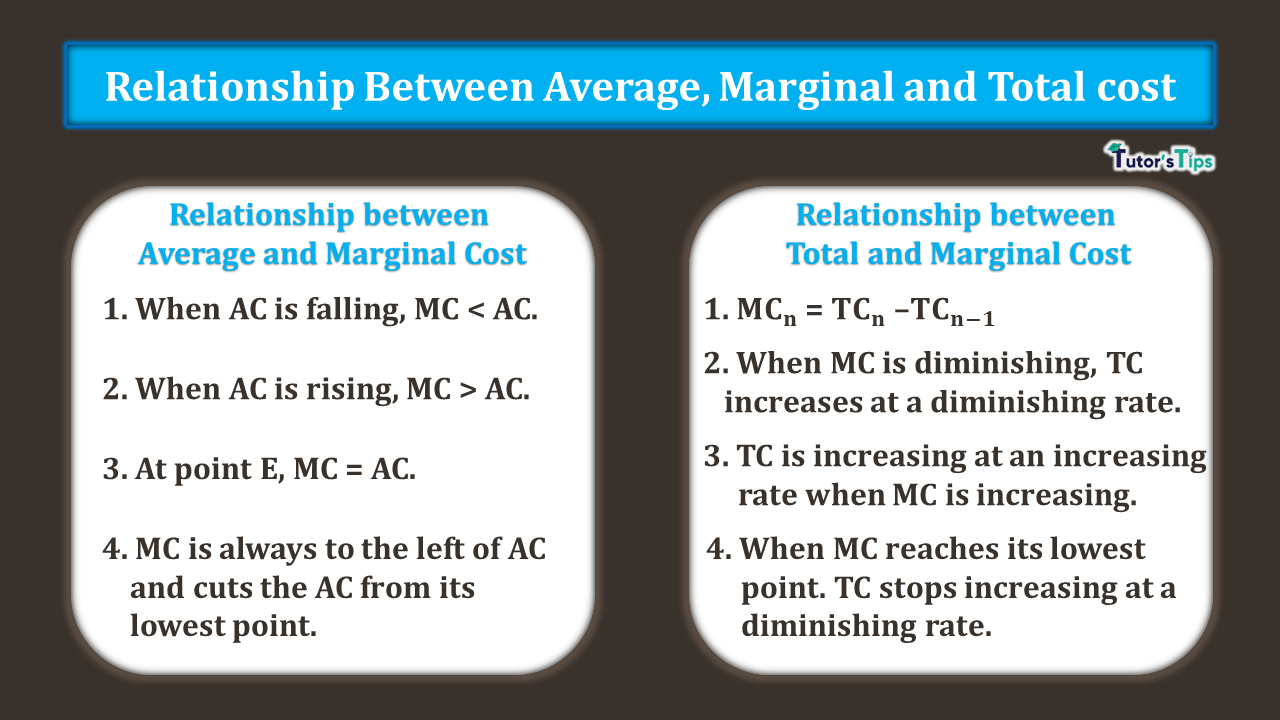
- When AC is falling, MC < AC: When the AC is falling, the MC is always less than the AC. In the graph, till point E, MC continues to be lower than the AC. In this case, the marginal cost falls more rapidly than the average cost. Therefore, when MC is falling, it is below the average cost.
- When AC is rising, MC > AC: When the average cost starts rising as from Rs. 17 to Rs. 18, the marginal cost is greater than the average cost. In fig, After the point E, the AC starts increasing and MC is higher than the AC.
- At point E, MC = AC: When the average cost remains constant, then MC= AC. It occurs at the point of minimum AC. Hence, it is clear from the graph, at point E, the MC and AC intersect each other. Therefore, at this point, MC= AC.
- MC is always to the left of AC and cuts the AC from its lowest point.
Relationship between total cost and marginal cost:
The relationship between total cost and marginal cost can also be observed from the above table and the graph. It is cleared from the representation that:
- Marginal cost is the difference between the total cost of two successive units of output. Hence, MCn = TCn – TCn-1.
- When MC is diminishing, TC increases at a diminishing rate.
- TC is increasing at an increasing rate when MC is increasing.
- When MC reaches its lowest point. TC stops increasing at a diminishing rate.
Thus, in short, we can say that MC is the rate of TC. Also, it is important to note that the relation between TVC and MC is the same as between MC and TC. It is because the difference between TC and TVC equals constant Fixed cost.
Thanks, and please share with your friends
Comment if you have any questions.
References:
Introductory Microeconomics – Class 11 – CBSE (2020-21)