Loading Tutorstips...
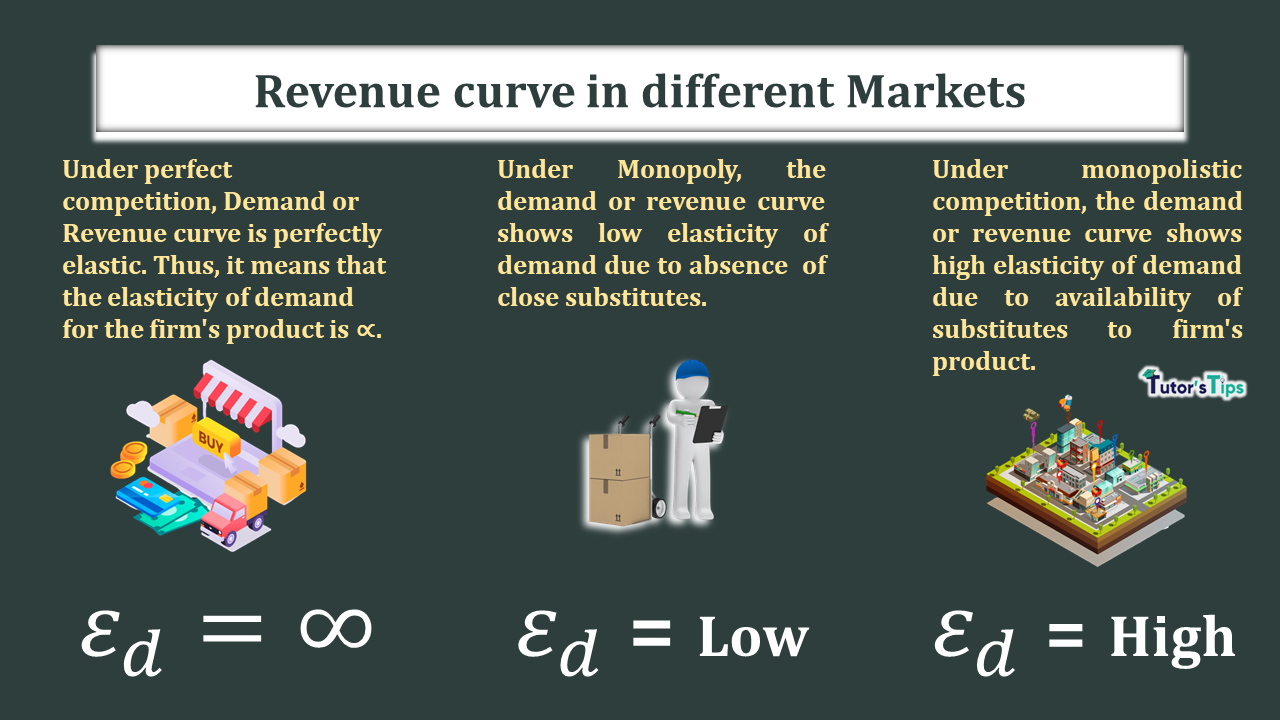
The elasticity of the Demand or Revenue curve in different markets shows different slopes. As a result, the respective degree of elasticity of demand also varies with the variable market situations.
Firstly, To understand the behaviour of the revenue curve in different market situations, the market can be classified as:
As we know the revenue curves are different in different markets which can be overseen as:
Revenue curve under perfect competition for a firm is represented by a straight line parallel to the X-axis showing output. The average revenue or price and MR remain constant for the firm.
Under perfect competition or Perfectly competitive market, the firm is a price taker. It cannot change the market price as it has to sell its products at the price prevailing in the market. If a firm tries to sell its products at a price above the market price, it can lose its customers in the market. It is because there would be other firms in the market which sell the same products at the price prevailing in the market or at a lower price than the firm's price.
Therefore, under perfect competition, the firm has to accept the price prevailing in the market-determined by market forces such as demand and supply. Hence, it means that the average revenue or the price would remain constant for the firm. Furthermore, constant AR implies constant MR. Thus, it means that under perfect competition, AR=MR=Price.
To read in detail, check out:
https://tutorstips.com/revenue-curve-under-perfect-competition/
Average and Marginal Revenue curve under Monopoly for a firm is represented by the downward sloping curves but in this case, MR< AR.
Under Monopoly market, there is a single seller in the market. Thus, a monopolist is a price maker. It implies that if a monopolist firm wants to sell more in the market, it can reduce the price of the product. Under this type of market, the firm's average revenue curve slopes downward from left to right. Being a single seller of the product in the market, the monopolist can fix the price whatever he wishes to. But, he can sell more of his products only at less price. Thus, there is a negative relationship between the demand for a product and its price in the monopoly market. Accordingly, the firm's AR curve or demand curve or price line slopes downward. Also, if the AR curve slopes downward, the MR curve slopes, and faster than the AR curve. So that MR<AR.
To read in detail, check out:
https://tutorstips.com/revenue-curve-under-monopoly-market/
Average and Marginal Revenue curve under Monopolistic competition for a firm is represented by the downward sloping curves but in this case, MR< AR. The basic difference between Monopoly and Monopolistic competition is that the AR curve under monopolistic competition is more elastic.
Under Monopolistic competition, the market involves features of both perfect competition and monopoly. It is more common than in the other two markets. Furthermore, in this type of market, there are a large number of sellers having products with some differentiation to create a monopoly in the market. As a result, there wouldn’t be more close substitute and competitive product in the market. It implies that if a monopolist firm wants to sell more in the market, it can reduce the price of the product. Under this type of market, the firm’s average revenue curve slopes downward from left to right.
Being a single seller of the differentiated product in the market, the monopolist can fix the price whatever he wishes to. But, he can sell more of his products only at less price. Thus, there is a negative relationship between the demand for a product and its price in the monopoly market. Accordingly, the firm’s AR curve or demand curve or price line slopes downward. As there is a lack of close substitute for monopoly product and availability of close substitute for a monopolistic firm. Therefore, the AR curve is more elastic than in Monopoly. Also, if the AR curve slopes downward, the MR curve also slopes downward, and faster than the AR curve. So that MR<AR.
To read in detail, check out:
https://tutorstips.com/revenue-curve-under-monopolistic-competition/
The following graph shows the graphical representation of the revenue curve or demand curve in different market situations and the degree of elasticity of demand:
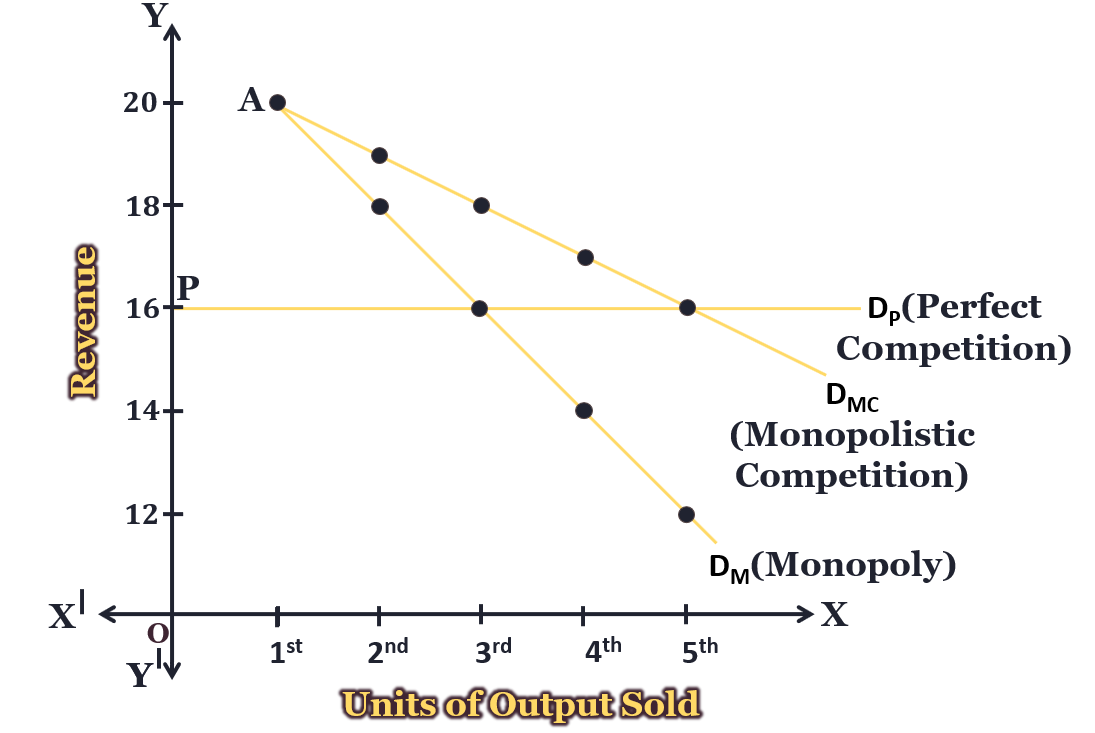
In fig, X-axis shows the output and Y-axis shows the revenue. DP, DMC and DM are the demand or revenue curve of Perfect competition, Monopolistic competition and Monopoly.
Following are the observations regarding the elasticity of the demand curve obtained from the graph:
Economics Educator
Mrs. Dilgeerjot Kaur holds a B.Com and M.Com degree and has over 9 years of teaching experience in microeconomics, macroeconomics, and business economics.
The elasticity of the Demand or Revenue curve in different markets shows different slopes . As a result, the respective degree of elasticity of demand also…
Class 11 and Class 12 commerce students, and CA Foundation aspirants, studying Economics Class 11.
Yes — this page includes a short interactive quiz so you can check your understanding straight away.