Loading Tutorstips...
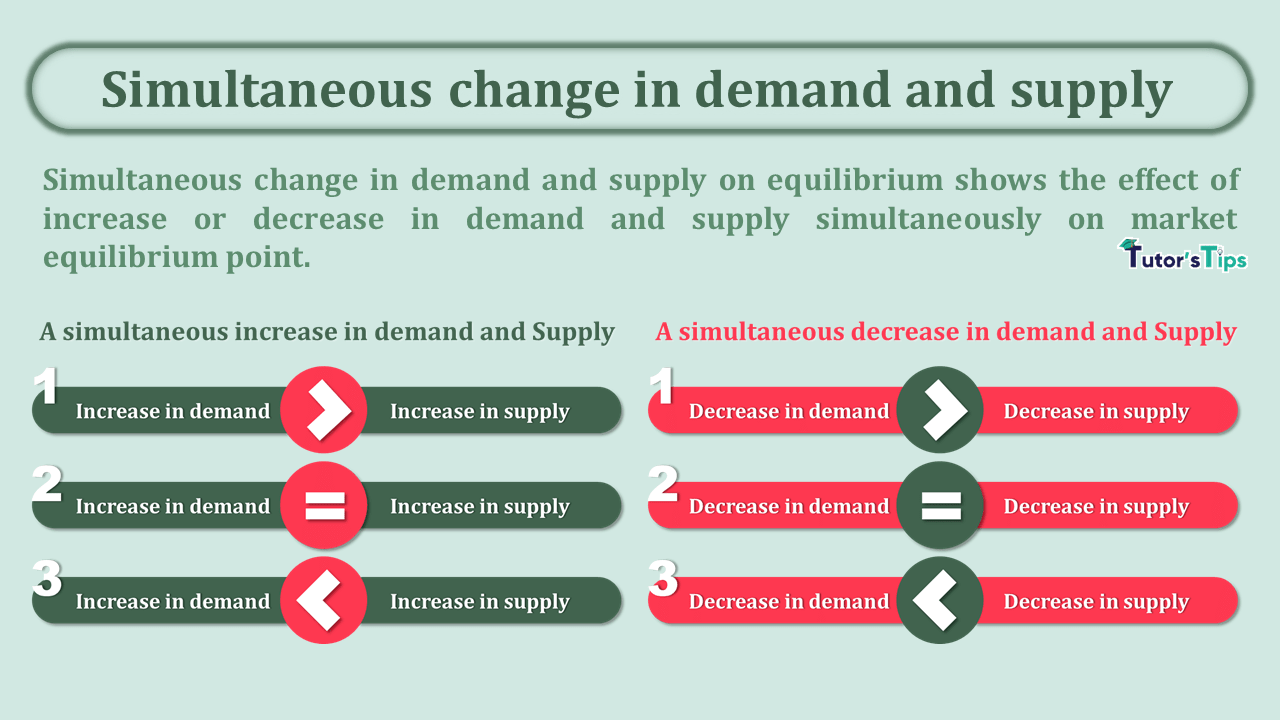
Simultaneous change in demand and supply on equilibrium shows the effect of increase or decrease in demand and supply simultaneously on market equilibrium point.
We have discussed the effect of change in demand and supply on market equilibrium separately. However, there are some situations when demand and supply changes simultaneously, these are:
The simultaneous increase in demand and supply results in an increase in the equilibrium quantity of the commodity. Whereas the change in price depends upon the following conditions:
When the increase in demand is greater than the increase in the supply of a commodity as a Simultaneous change in demand and supply, the equilibrium quantity and equilibrium price rises.
For example, initially, the consumers in a specific area demand Maggi noodles made from Maida. But due to health issues, their preferences have changed and they started demanding Atta Maggi Noodles. This results in an increase in demand for Atta Maggi noodles. As demand in the market increases, the sellers starts increasing the supply to meet the demand. But, they increase the supply to some extent because of the short period. Thus, the increase in demand in the market is greater than the supply of Atta Maggi noodles.
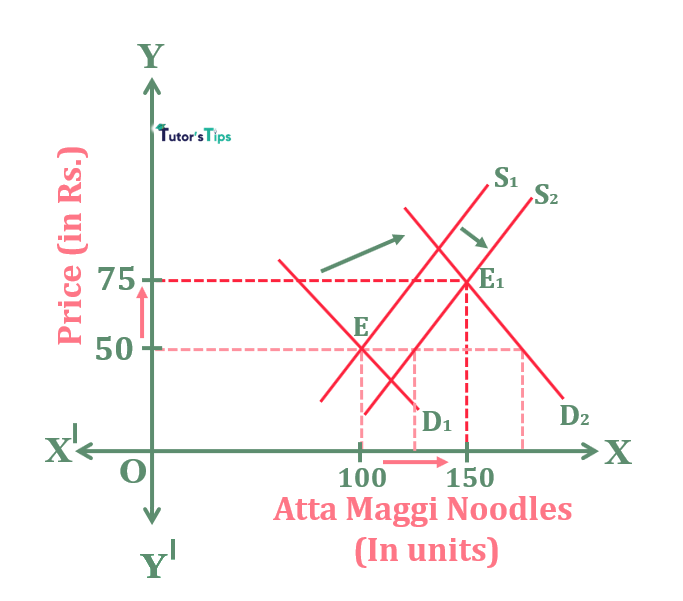
Suppose, initial equilibrium demand and supply of Atta Maggi noodles were 100 units at equilibrium price Rs.50. Therefore, the initial equilibrium point is E with D1 and S1 as the initial demand and supply curve. The increase in demand results in new quantity demanded as 175 units whereas the increase in supply is only 125 units. Here, it is very clear that the increase in demand (175-100 units) for the commodity is greater than the increase in supply(125-100 units) i.e.75 > 25. Consequently, the excess demand results in an increase in equilibrium price to Rs.75.
When the price increases, the demand contracts and supply extends. Demand contracts to 150 units whereas supply extends to 150 units. Hence, the new equilibrium point struck at point E1. Here, the D2 and S2 curve intersect each other. Thus, the new equilibrium quantity is 150 units with an equilibrium price of Rs.75.
Thus, when the increase in demand > increase in supply, then
When the increase in demand is equal to the increase in the supply of a commodity as a simulatenous change, the equilibrium quantity increases and the equilibrium price doesn't get affected.
For example, initially, the consumers in a specific area demand Maggi noodles made from Maida. But due to health issues, their preferences have changed and they started demanding Atta Maggi Noodles. This results in an increase in demand for Atta Maggi noodles. As demand in the market increases, the sellers starts increasing the supply to meet the demand. Thus, the increase in demand in the market becomes equal to the supply of Atta Maggi noddles.
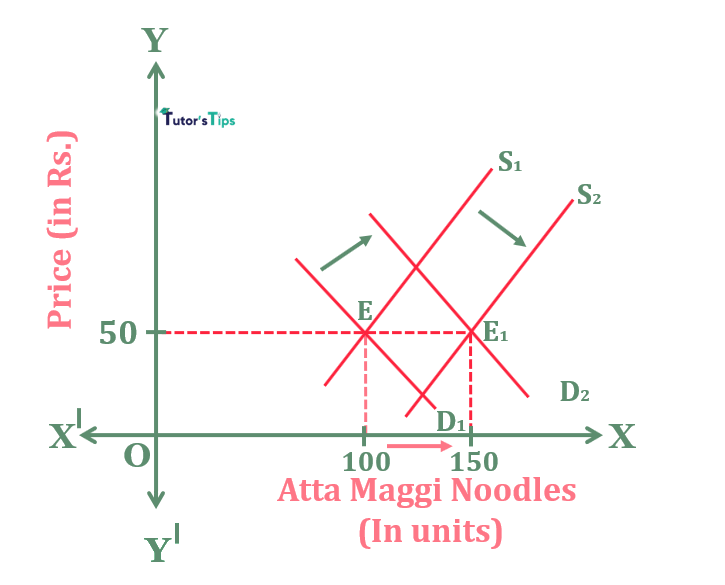
Suppose, initial equilibrium demand and supply of Atta Maggi noodles were 100 units at equilibrium price Rs.50. Therefore, the initial equilibrium point is E with D1 and S1 as the initial demand and supply curve. The increase in demand results in new quantity demanded as 150 units whereas the increase in supply is also 150 units. Here, it is very clear that the increase in demand for the commodity is equal to the increase in supply i.e.50 = 50. Consequently, there is no excess demand and excess supply in the market.
As a result, the equilibrium price remains unchanged i.e. Rs.50. However, the equilibrium quantity increases to 150 units from 100 units. There fore, E1 is the new equilibrium point.
Thus, when the increase in demand = increase in supply, then
When the increase in demand is less than the increase in the supply of a commodity as a simulatenous change, the equilibrium quantity increases and equilibrium price falls.
For example, initially, the consumers in a specific area demand Maggi noodles made from Maida. But due to health issues, their preferences have changed and they started demanding Atta Maggi Noodles. This results in an increase in demand for Atta Maggi noodles. As demand in the market increases, the sellers starts increasing the supply to meet the demand. But, the supply increased by sellers is more than the increase in demand. Thus, the increase in demand in the market is greater than the supply of Atta Maggi noddles.
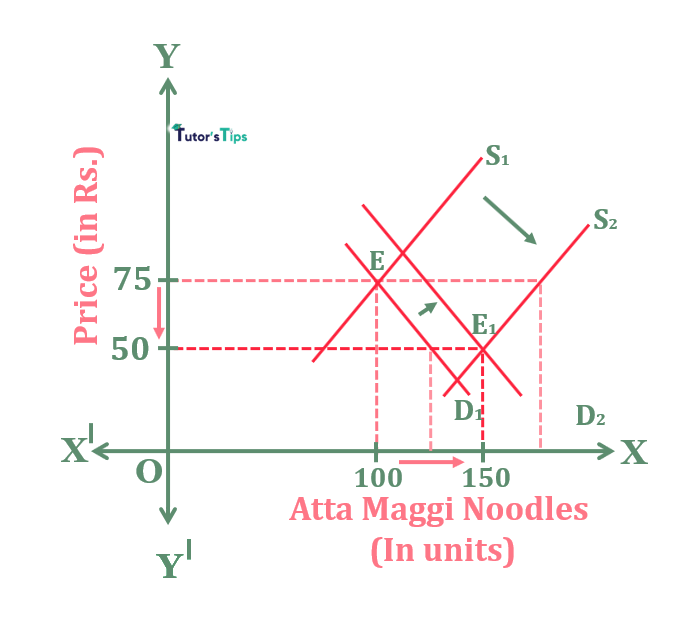
Suppose, initial equilibrium demand and supply of Atta Maggi noodles were 100 units at equilibrium price Rs.75. Therefore, the initial equilibrium point is E with D1 and S1 as the initial demand and supply curve. The increase in demand results in new quantity demanded as 125 units whereas the increase in supply results in 175 units. Here, it is very clear that the increase in demand (125-100 units) for the commodity is less than the increase in supply(175-100 units) i.e.25 < 75. Consequently, the excess supply results in a decrease in equilibrium price to Rs.50.
When the price decreases, the demand extends and supply contracts. Demand extends to 150 units whereas supply contracts to 150 units. Hence, the new equilibrium point struck at point E1. Here, the D2 and S2 curve intersect each other. Thus, the new equilibrium quantity is 150 units with an equilibrium price of Rs.50.
Thus, when the increase in demand < increase in supply, then
The simultaneous increase in demand and supply results in a decrease in the equilibrium quantity of the commodity. Whereas the change in price depends upon the following conditions:
When the decrease in demand is greater than the decrease in the supply of a commodity as a Simultaneous change in demand and supply, the equilibrium quantity and equilibrium price falls.
For example, initially, the consumers in a specific area demand Maggi noodles made from Maida. But due to health issues, their preferences have changed and they started demanding Atta Maggi Noodles. This results in a decline in demand for Maida Maggi noodles. As demand in the market decreases, the sellers start decreasing the supply to avoid excess supply. But, they decrease the supply to some extent because of the short period. Thus, the decrease in demand in the market is greater than the supply of Maida Maggi noddles.
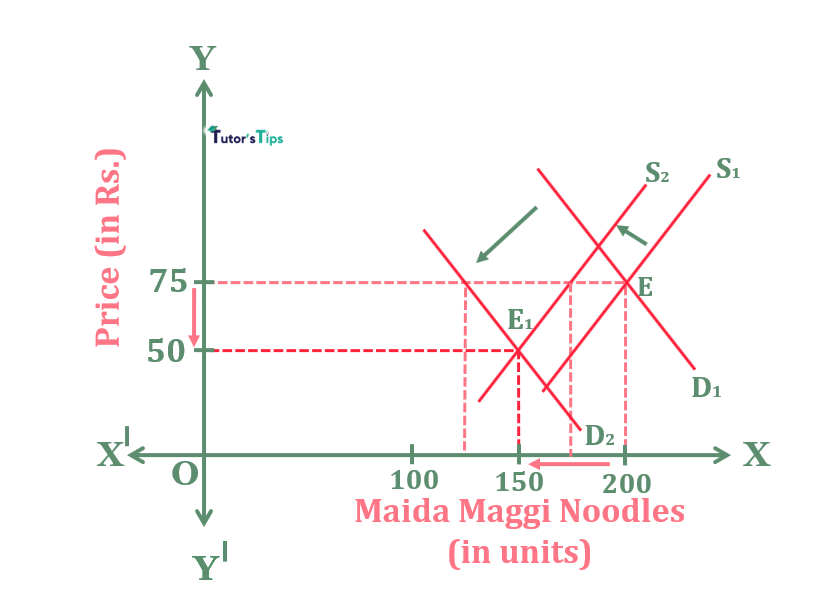
Suppose, initial equilibrium demand and supply of Maida Maggi noodles were 200 units at equilibrium price Rs.75. Therefore, the initial equilibrium point is E with D1 and S1 as the initial demand and supply curve. The decrease in demand results in new quantity demanded as 125 units whereas the decrease in supply results in 175 units. Here, it is very clear that the decrease in demand (200-125 units) for the commodity is greater than the decrease in supply(200-175 units) i.e.75 > 25. Consequently, the excess supply results in a decrease in equilibrium price to Rs.50.
When the price decreases, the demand extends and supply contracts. Demand extends to 150 units whereas supply contracts to 150 units. Hence, the new equilibrium point struck at point E1. Here, the D2 and S2 curve intersect each other. Thus, the new equilibrium quantity is 150 units with an equilibrium price of Rs.50.
Thus, when the decrease in demand > decrease in supply, then
When the decrease in demand is equal to the decrease in the supply of a commodity as a Simultaneous change in demand and supply, the equilibrium quantity falls and the equilibrium price gets unaffected.
For example, initially, the consumers in a specific area demand Maggi noodles made from Maida. But due to health issues, their preferences have changed and they started demanding Atta Maggi Noodles. This results in a decline in demand for Maida Maggi noodles. As demand in the market decreases, the sellers start decreasing the supply to avoid excess supply. Thus, the decrease in demand in the market becomes equal to the decrease in the supply of Maida Maggi noddles.
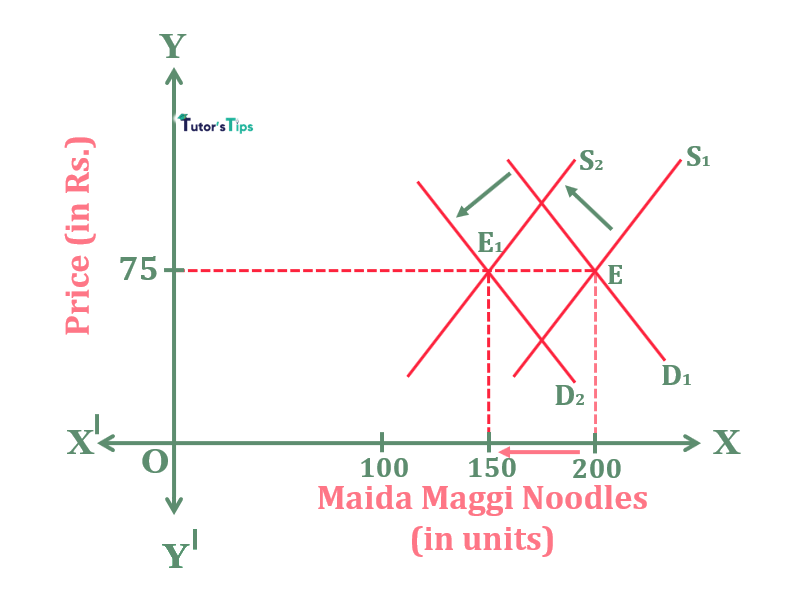
Suppose, initial equilibrium demand and supply of Maida Maggi noodles were 200 units at equilibrium price Rs.75. Therefore, the initial equilibrium point is E with D1 and S1 as the initial demand and supply curve. The decrease in demand results in new quantity demanded as 150 units whereas the decrease in supply results in 150 units. Here, it is very clear that the decrease in demand (200-175units) for the commodity is equal to the decrease in supply(200-175 units) i.e.50 = 50. Consequently, there is no excess demand or supply in the market.
As a result, the equilibrium price remains unchanged i.e. Rs.75. However, the equilibrium quantity decreases to 150 units from 200 units. There fore, E1 is the new equilibrium point.
Thus, when the decrease in demand = decrease in supply, then
When the decrease in demand is less than the decrease in the supply of a commodity as a simulatenous change, the equilibrium quantity falls and the equilibrium price rises.
For example, initially, the consumers in a specific area demand Maggi noodles made from Maida. But due to health issues, their preferences have changed and they started demanding Atta Maggi Noodles. This results in a decline in demand for Maida Maggi noodles. As demand in the market decreases, the sellers start decreasing the supply to avoid excess supply. But, they decrease the supply to the extent that supply becomes shorter than demand. Thus, the decrease in demand in the market is greater than the supply of Maida Maggi noddles.
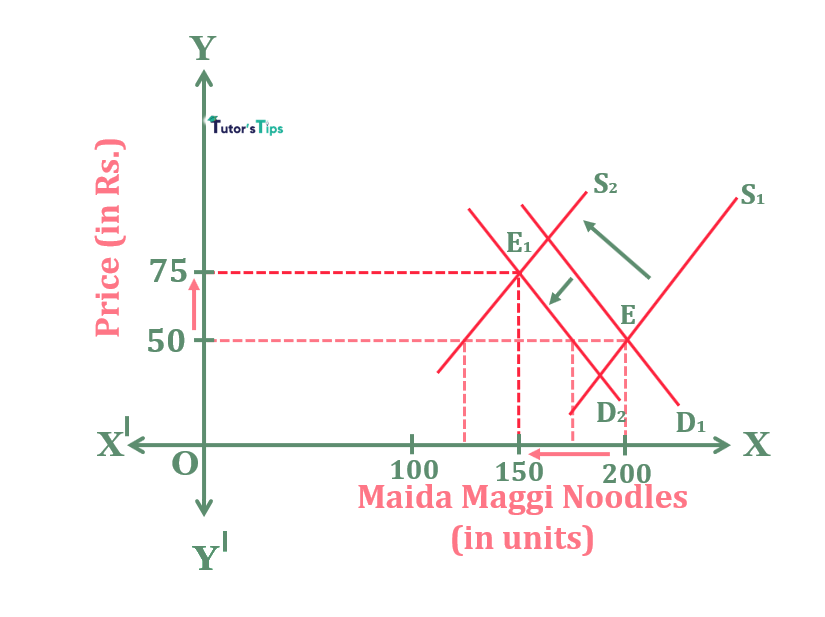
Suppose, initial equilibrium demand and supply of Maida Maggi noodles were 200 units at equilibrium price Rs.50. Therefore, the initial equilibrium point is E with D1 and S1 as the initial demand and supply curve. The decrease in demand results in new quantity demanded as 175 units whereas the decrease in supply results in 125 units. Here, it is very clear that the decrease in demand (200-175 units) for the commodity is greater than the decrease in supply(200-125 units) i.e.25 < 75. Consequently, the excess demand results in an increase in equilibrium price to Rs.75.
When the price increases, the demand contracts and supply extends. Demand contracts to 150 units whereas supply extends to 150 units. Hence, the new equilibrium point struck at point E1. Here, the D2 and S2 curve intersect each other. Thus, the new equilibrium quantity is 150 units with an equilibrium price of Rs.75.
Thus, when the decrease in demand < decrease in supply, then
Thanks!!!
Economics Educator
Mrs. Dilgeerjot Kaur holds a B.Com and M.Com degree and has over 9 years of teaching experience in microeconomics, macroeconomics, and business economics.
Simultaneous change in demand and supply on equilibrium shows the effect of increase or decrease in demand and supply simultaneously on market equilibrium…
Class 11 and Class 12 commerce students, and CA Foundation aspirants, studying Economics Class 11.
Yes — this page includes a short interactive quiz so you can check your understanding straight away.