Loading Tutorstips...
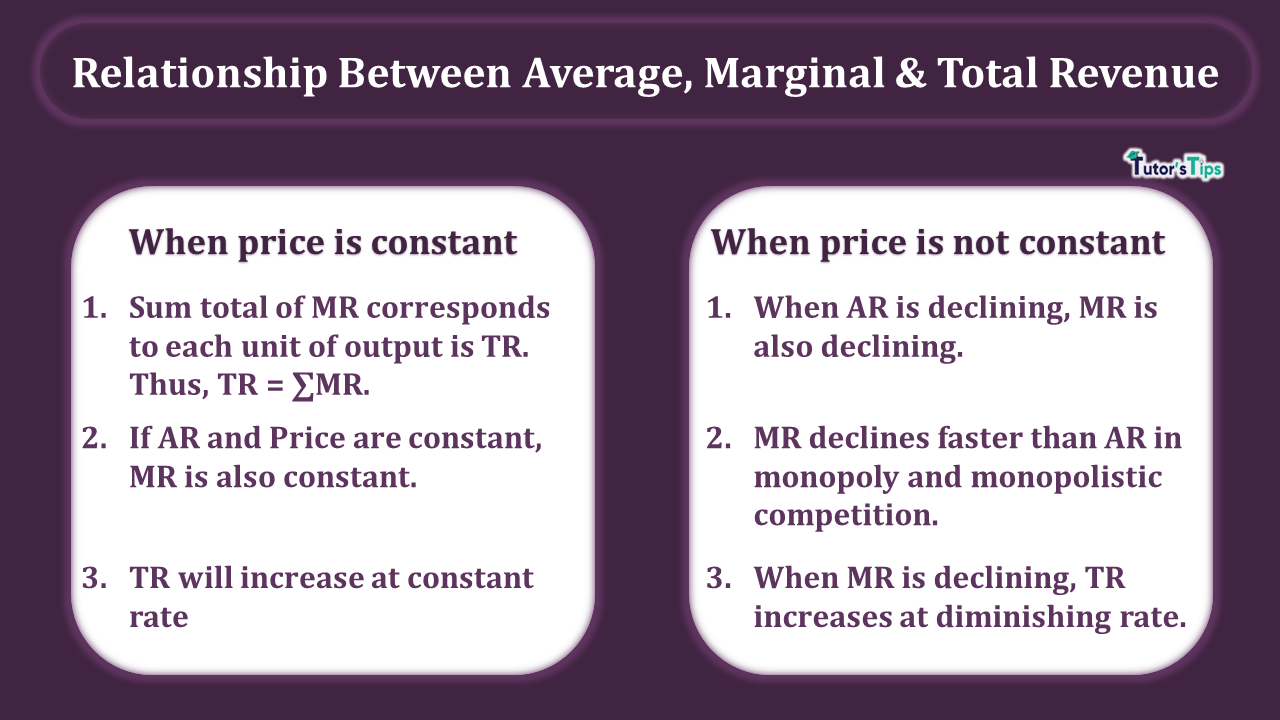
Relationship between Average, marginal and total revenue defines the relationships among these terms.
As we have already discussed, what these terms are. We have understood the following relations:
The relationship between these terms can be classified as:
Under perfect competition, the firms are the price takers. A firm can never set the price of any commodity by its own in this type of market, it has to follow the market price. Since the price is determined in the market, the price is considered as constant. Thus, we can say that Price = AR of the firm. Moreover, it implies that it can sell any quantity at a given price or given AR.
Let us assume the price and AR be Rs 20. Given this, the TR, MR and TR schedule of the firm would be:
| Output (in units) | Price (P =AR) | Total Revenue | Marginal Revenue |
| 1 | 20 | 20*1=20 | 20-0=20 |
| 2 | 20 | 20*2=40 | 40-20=20 |
| 3 | 20 | 20*3=60 | 60-40=20 |
| 4 | 20 | 20*4=80 | 80-60=20 |
| 5 | 20 | 20*5=100 | 100-80=20 |
The above schedule explains the following relationship among these concepts:
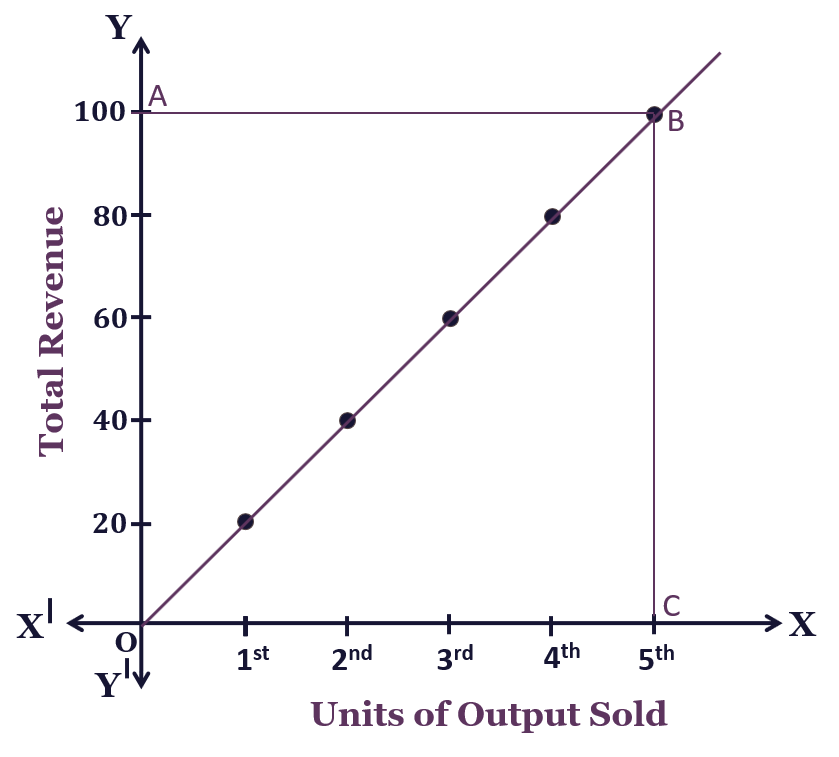
In fig, it os shown that the output level is OC, TR = OA. Alternatively, the TR can be estimated as multiple of AR and quantity. So that TR = AR * Output. The total area covered in OABC is showing the total revenue of the firm when price is constant.
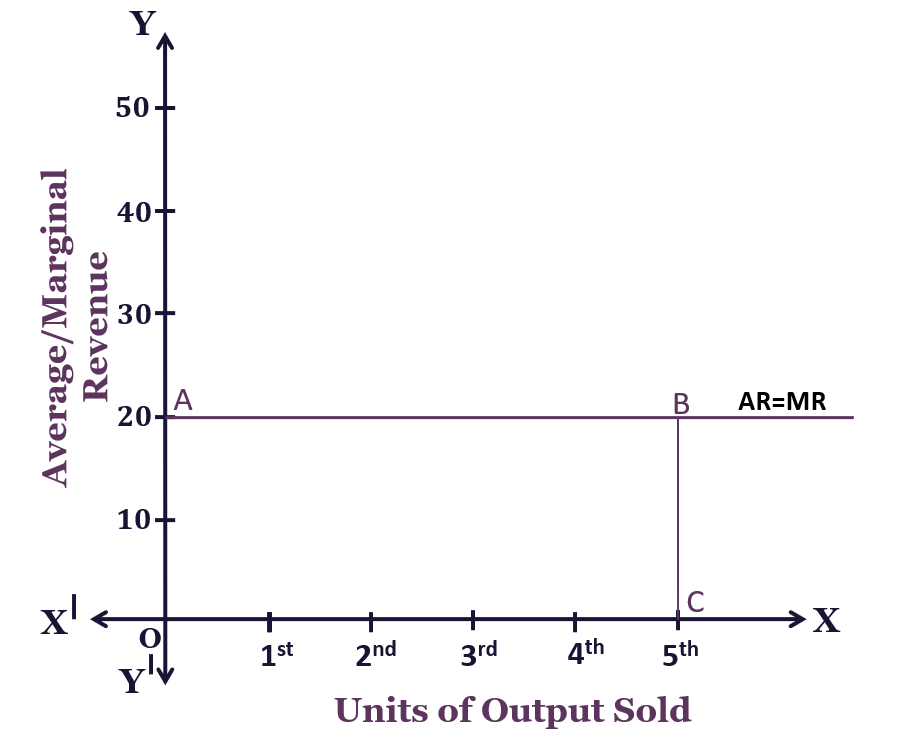
In fig, it is assumed that the price is constant for the firm. Thus,
Here, AR= MR=OA.
If output is OC,
Then, TR = OA*OC = AREA (OABC)
Here, OA refers to price
OC refers to the output
And, area OABC denotes total revenue.
Under monopoly and monopolistic competition, the price or AR tends to decrease with increase in output. In such a situation, the relation can be explained with following schedule:
| Output (in units) | Price (P = AR) | Total Revenue | Marginal Revenue |
| 1 | 20 | 20*1=20 | 20-0=20 |
| 2 | 19 | 19*2=38 | 38-20=18 |
| 3 | 18 | 18*3=54 | 54-38=16 |
| 4 | 17 | 17*4=68 | 68-54=14 |
| 5 | 16 | 16*5=80 | 80-68=12 |
The above table observed following relationship between AR, MR and TR:
Yes, MR can be zero or Negative. The following schedule clears this concept:
Output(in units) |
Price or AR | TR | MR |
| 1 | 70 | 70 | 70-0=70 |
| 3 | 50 | 150 | (150-70)/2 = 40 |
| 5 | 30 | 150 | (150-150)/2 = 0 |
| 6 | 20 | 120 | (120-150)=-30 |
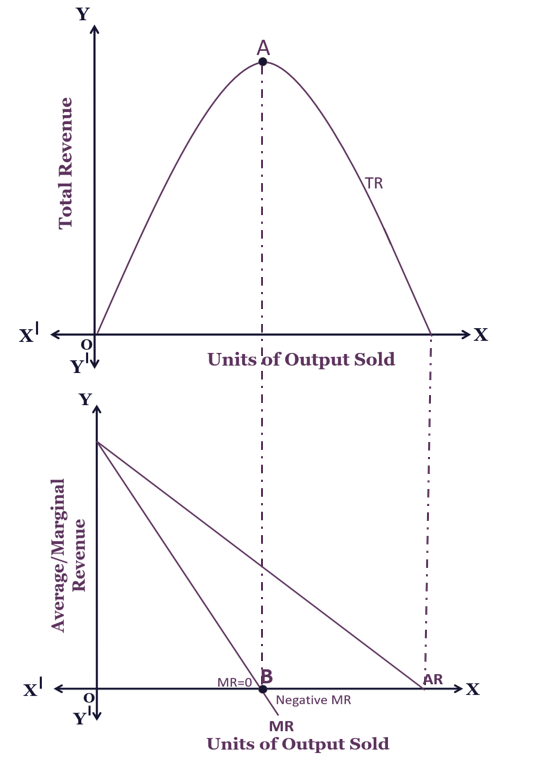
The above fig, it is observed that:
Economics Educator
Mrs. Dilgeerjot Kaur holds a B.Com and M.Com degree and has over 9 years of teaching experience in microeconomics, macroeconomics, and business economics.
Relationship between Average, marginal and total revenue defines the relationships among these terms. Relationship between Average Marginal and Total Revenue:…
Class 11 and Class 12 commerce students, and CA Foundation aspirants, studying Economics Class 11.
Yes — this page includes a short interactive quiz so you can check your understanding straight away.