In Economics, the “movement along the Demand curve” and “shift in demand curve” represent very different market situations. These two terms define the change in demand due to a change in its factors.
Meaning of Demand Curve :
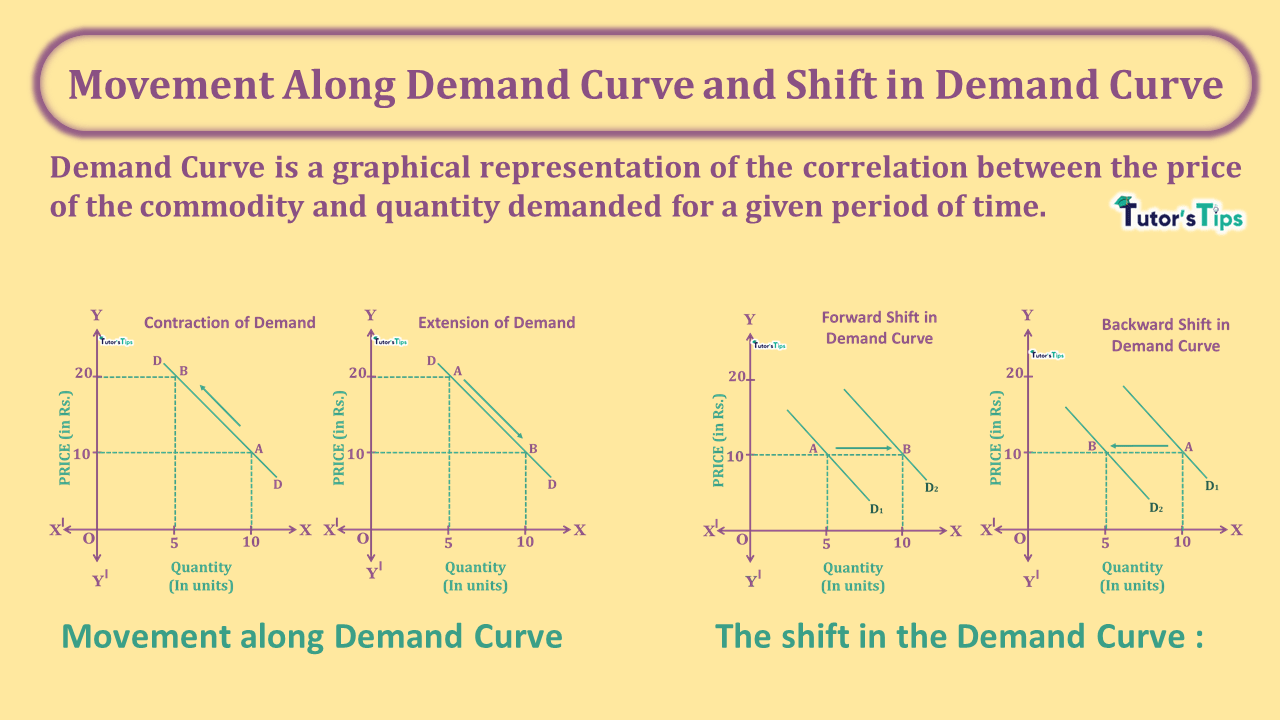
Demand Curve is a graphical representation of the correlation between the price of the commodity and quantity demanded for a given period of time.
This curve is affected by the change in quantity demanded. The movement along the demand curve and shift in the demand curve explain the change in the demand. When the demand of commodity changes due to changes in its price, it is shown by movement along the demand curve and shift in the demand curve shows the change in quantity demanded due to changes in factors of demand other than its price.
Movement along Demand Curve :
It refers to a change along the demand curve. On the demand curve, a movement expresses a change in both price and quantity demanded from one point to another on the curve. Therefore, it can be said that movement along the demand curve represents the variation in the quantity demanded of a commodity with a change in its price, assuming other factors constant.
As we know, the quantity demanded of a commodity changes with an increase or decrease in its price while other factors of demand remain unchanged. When we show this change on a graph, it is known as movement along the demand curve.
The movement along the demand curve can be classified as :
- Extension of Demand
- Contraction of Demand
Extension of Demand :
When the quantity demanded of a commodity increase with a fall in its price, it is known as an extension of demand, other things being equal.
This can be understood by the following illustration:
Suppose, the price of ice cream is Rs.20 and the quantity demanded is 5 units. When the price decreases to Rs. 10, the demand extends to 10 units.
| Price of Ice Cream (in Rs.) | Quantity demanded (in units) |
| 20 | 5 |
| 10 | 10 |
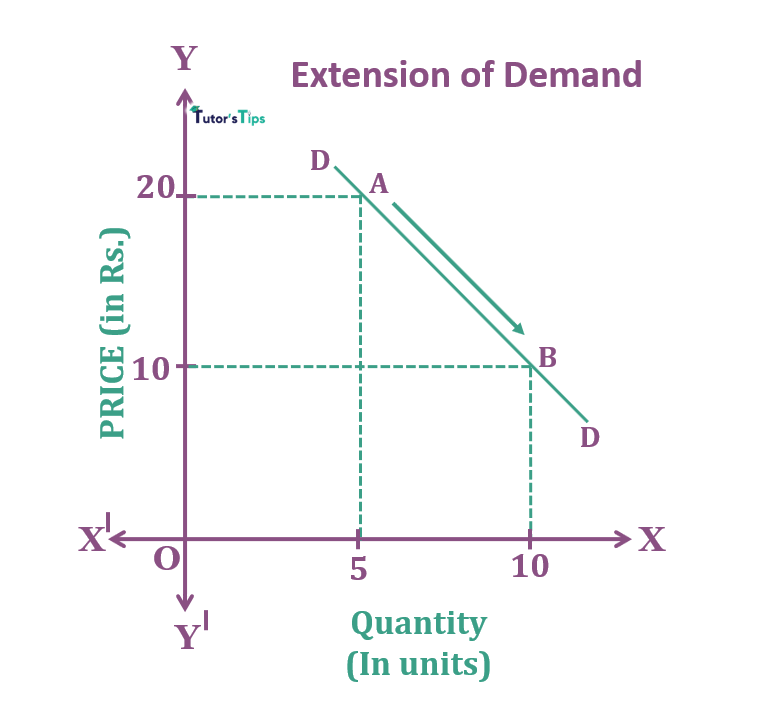
In Fig, X-axis shows the quantity and Y-axis shows the price. When the price is Rs20, the quantity supplied of ice cream is 5 units. As the price decreases to Rs10, its demand increases to 10 units. It implies the movement from a higher point to a lower point along the same demand curve. Thus, It is known as an extension of demand.
Contraction of Demand :
When the quantity demanded of a commodity decrease with a rise in its price, it is known as a contraction of demand, other things being equal.
This can be understood by the following illustration:
Suppose, the price of ice cream is Rs.10 and the quantity demanded is 10 units. When the price increases to Rs. 20, the demand contracts to 5 units.
| Price of Ice Cream (in Rs.) | Quantity Demanded (in units) |
| 10 | 10 |
| 20 | 5 |

In fig, X-axis shows the quantity of ice cream and the Y-axis shows the price. When the price is Rs 20, the supply is 10 units. As price decreases to Rs10, its supply also falls to 5 units. It implies the movement from the lower point to a higher point on the same demand curve, thus called a contraction of demand.
The shift in the Demand Curve :
When the demand of commodity changes due to changes in factors other than its price such as the price of related goods, cost of production, technology, etc., the demand curve doesn’t extend or contract but shifts entirely. Then, it is known as the Shift in the Demand Curve.
For example, the income of consumers increases in the market, which leads to more demand due to changes in other factors of demand.
The shifts in the demand curve can be classified as :
- Forward Shift in Demand Curve
- Backward Shift in Demand Curve
Forward Shift in Demand Curve:
When the demand increases due to the change in determinants of demand other than its price, it refers to a forward shift in the demand curve. Thus, It refers to a situation when even at a constant price of the commodity, the demand increases.
This can be understood by the following illustration:
Suppose, the price of ice cream is Rs.10 and the quantity demanded is 5 units. Keeping the price constant at Rs.10, due to changes in other factors, the demand increases to 10 units.
| Price of Ice Cream (in Rs.) | Quantity Demanded (in units) |
| 10 | 5 |
| Rs. 10 | 10 |
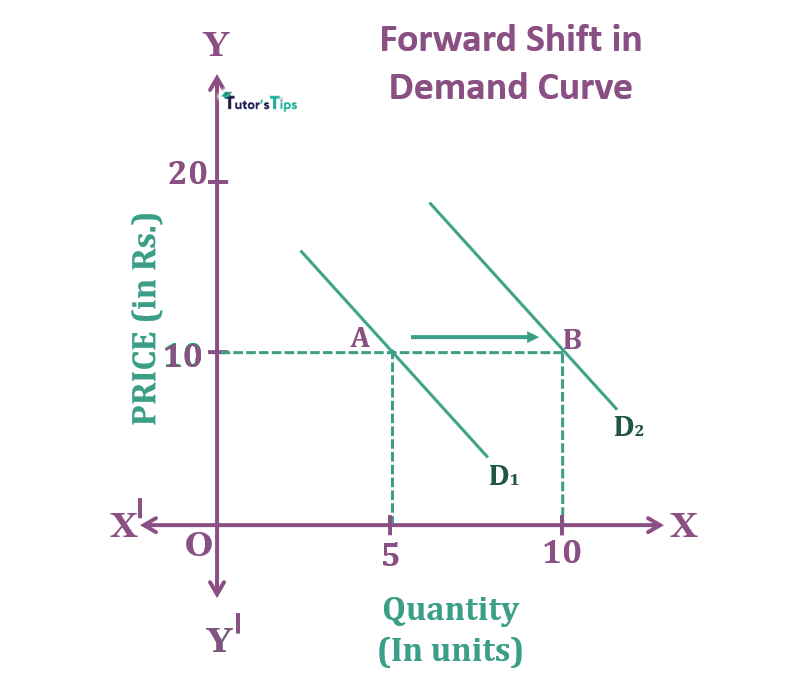
In fig, X-axis shows the quantity of ice cream and the Y-axis shows the price. Here, even the price remains constant at Rs.10, due to a change in consumers’ behavior, the quantity demanded increases to 10 units from 5 units. As a result, the demand curve shifts from D1 to D2. Thus, It shows that the demand of consumers is increasing at a constant price.
Here, it is important to note that the increase in demand is represented by a shift in the demand curve to the right. Therefore, it is known as a forward shift in the demand curve.
Reasons for a forward shift in the demand curve :
- Price of substitute goods increases.
- Increase in the income of consumers.
- The price of complementary goods falls.
- Tastes and preferences of consumers shifts in favor of commodity due to change in fashion and climate.
- Availability of commodities is expected to fall in near future.
Backward Shift in Demand Curve :
When the demand decreases due to the change in determinants of demand other than its price, it refers to a backward shift in the demand curve. Thus, It refers to a situation when even at a constant price of the commodity, the demand decreases.
Suppose, the price of ice cream is Rs.10 and the quantity demanded is 10 units. Keeping the price constant at Rs.10, due to changes in other factors, the demand decreases to 5 units.
| Price of Ice Cream (in Rs.) | Quantity Demanded (in units) |
| 10 | 10 |
| Rs. 10 | 5 |
In fig, X-axis shows the quantity of ice cream and the Y-axis shows the price. Here, even the price remains constant at Rs.10, due to a change in consumers’ behavior, the quantity demanded decreases to 5 units from 10 units. As a result, the demand curve shifts from D1 to D2. Thus, It shows that the demand of consumers is decreasing at a constant price.
Here, it is important to note that the decrease in demand is represented by a shift in the demand curve to the left. Therefore, it is known as a backward shift in the demand curve.
Reasons for a backward shift in the demand curve :

- Price of substitute goods decreases.
- Decrease in the income of consumers.
- The price of complementary goods rises.
- Tastes and preferences of consumers shift against commodities due to change in fashion and climate.
- The availability of commodities is expected to rise in near future.
Thanks!!!
Please share with your friends
Comment if you have any question
References:
Introductory Microeconomics – Class 11 – CBSE (2020-21)