Loading Tutorstips...
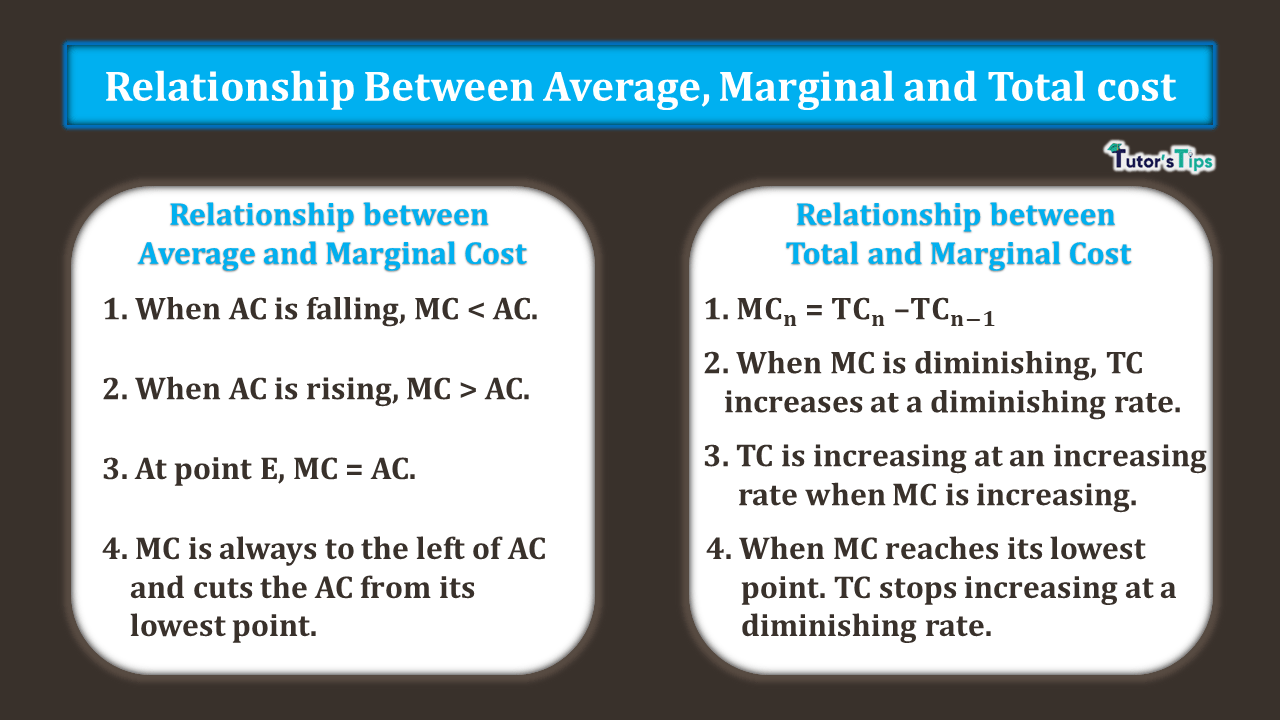
Relationship between average marginal and total cost defines how these terms are interlinked with each other.
The relationship between these terms explains how these costs are related to each other. We can understand this relationship by :
(I)Relationship between average and marginal cost
(II) Relationship between total cost and marginal cost
It explains how the average and marginal costs are related to each other at different levels of output. It can easily be understood with tabular and graphical representation:
| Output (in units) | Total Cost (Rs.) | Average Cost (Rs) | Marginal Cost (Rs) |
| 0 | 20 | ∞ | - |
| 1 | 40 | 40 | 20 |
| 2 | 56 | 28 | 16 |
| 3 | 69 | 23 | 13 |
| 4 | 80 | 20 | 11 |
| 5 | 90 | 18 | 10 |
| 6 | 102 | 17 | 12 |
| 7 | 126 | 18 | 24 |
The above table shows how AC and MC react with respect to each other. It can be shown graphically :
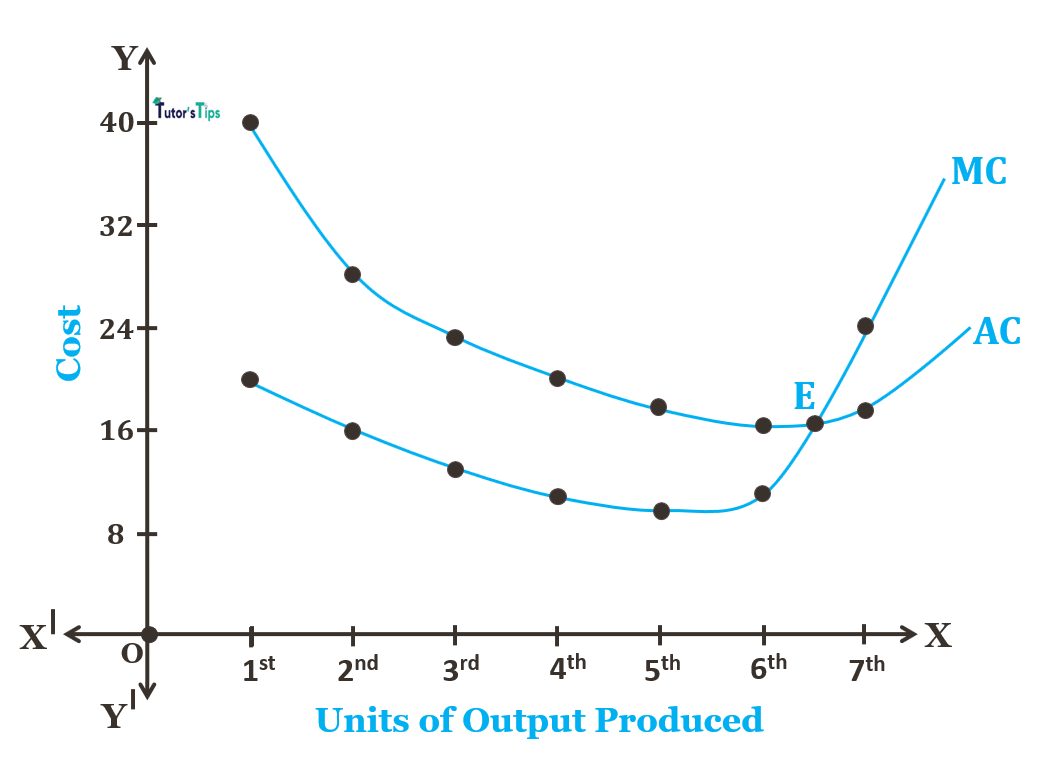
In fig, X-axis shows the output and Y-axis shows the cost. MC and AC curves are Marginal cost and Average cost curves respectively.
The relationship between total cost and marginal cost can also be observed from the above table and the graph. It is cleared from the representation that:
Thus, in short, we can say that MC is the rate of TC. Also, it is important to note that the relation between TVC and MC is the same as between MC and TC. It is because the difference between TC and TVC equals constant Fixed cost.
Economics Educator
Mrs. Dilgeerjot Kaur holds a B.Com and M.Com degree and has over 9 years of teaching experience in microeconomics, macroeconomics, and business economics.
Relationship between average marginal and total cost defines how these terms are interlinked with each other. Relationship between AC, MC and TC: The…
Class 11 and Class 12 commerce students, and CA Foundation aspirants, studying Economics Class 11.
Yes — this page includes a short interactive quiz so you can check your understanding straight away.