Loading Tutorstips...
✦ FREE LEARNING — CLASS 11 & 12 — CBSE · PSEB — ACCOUNTS · ECONOMICS · BST ✦
The law of supply reflects the producers' or sellers' general tendency in selling their products to consumers at various prices.
Law of Supply expresses the relationship between price and quantity supplied of a given commodity. It states that "other things remain constant, supply increases with the rise in price and decreases with fall in price" This happens due to change in producer's behaviour for change in price.
Thus, it shows the direct relationship between quantity supplied of given commodity and its price. This law defines the direction in which quantity supplied changes with a change in price. The other things include all those factors which directly or indirectly affect the supply such as the price of related goods, technology and expectations of sellers.
"The law of supply states that other things being equal, the higher the price, the greater the quantity supplied or the lower the price, the smaller the quantity supplied."
"The law of supply states that other things being equal, the quantity of any commodity that firms will produce and offer for sale is positively related to the commodity's price, rising when price rises and falling when the price falls."
For Example,
Suppose, when the price of cupcakes decreases from Rs 100 per piece to Rs 80 per piece, the quantity supplied will decline. The bakeries will lessen its output to avoid profits from the fall in price whether increases the supply of doughnuts having a higher price.
Similarly, if the price of coffee at local Starbucks raises from Rs.800 to Rs.1000, the quantity supplied will be increased. The suppliers would prefer to sell more to earn more profits.
The law of Supply can be illustrated with the help of supply schedule and supply curve. These are shown as follows :
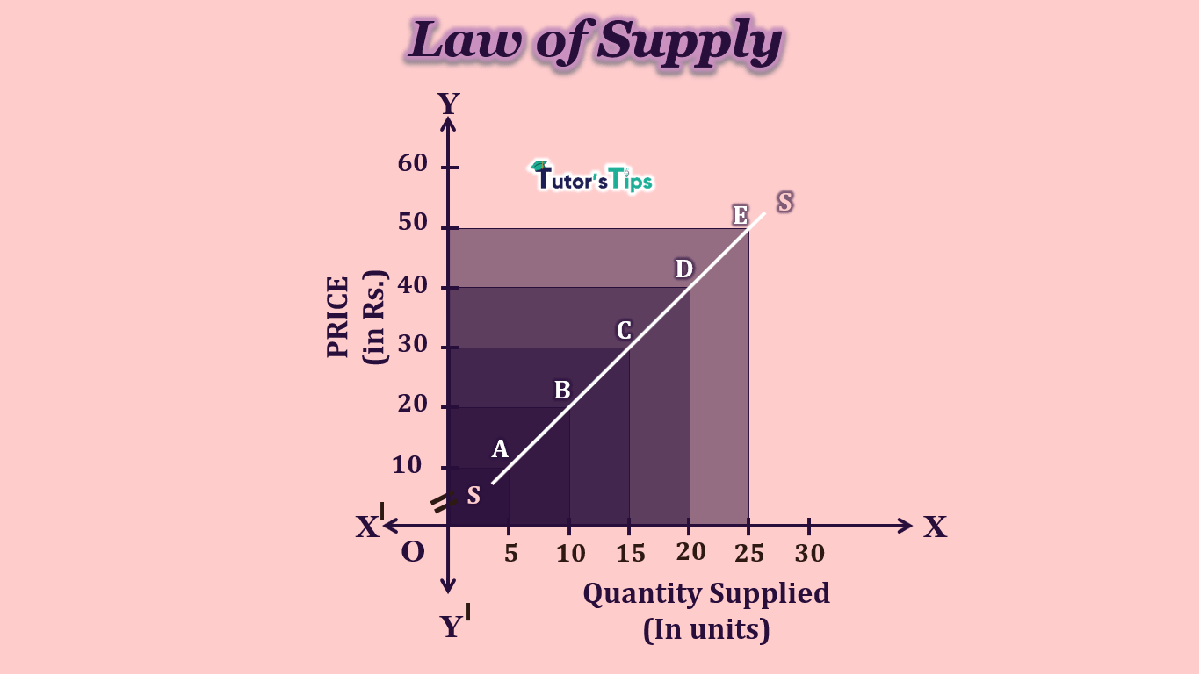
The following schedule shows the series of prices and quantity supplied of ice cream as follows:
| Price of Ice Cream (Rs) |
Quantity Supplied (in units) |
| 10 | 5 |
| 20 | 10 |
| 30 | 15 |
| 40 | 20 |
| 50 | 25 |
The above table shows that when the price of ice cream is Rs 10, there are 5 units of ice cream supplied. As the price rises to Rs 20, the quantity supplied increases to 10 units. Similarly, the rise in price to Rs.30,40 and 50 follows an increase in quantity supplied as 15,20 and 25 units.
The following graph shows the relationship between price and quantity supplied as the law of supply defines. In this graph, X-axis shows the quantity supplied of ice cream and Y-axis shows the price. SS is the supply curve whereas A, B, C, D and E points show the relationship between price and quantity supplied. When the price is Rs 10, the quantity supplied is 5 units of ice cream. As the price increases to Rs 20, the quantity supplied also rises to 10 units. Similarly, as the price goes up to Rs 30,40 and 50, its supply also increases to 15,20 and 25 units respectively.
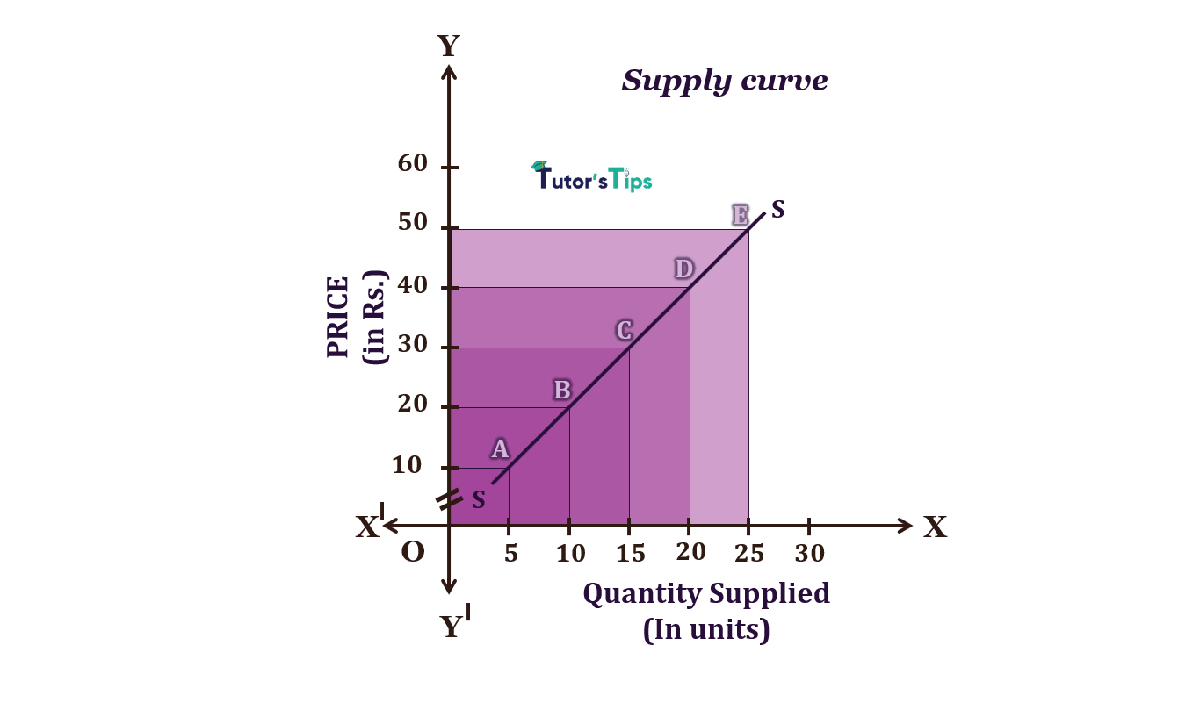
It clears that the price of commodity increases, the quantity supplied of the same also increases and vice-versa, provided other things being constant. In short, we can say that the law of supply describes the behaviour of producers and sellers as they plan to increase the production of the product to gain from market conditions which lead to an increase in supply. When this direct relationship between price and quantity supplied is graphed, the result is a supply curve.
Thanks for reading the topic
Economics Educator
Mrs. Dilgeerjot Kaur holds a B.Com and M.Com degree and has over 9 years of teaching experience in microeconomics, macroeconomics, and business economics.
The law of supply reflects the producers' or sellers' general tendency in selling their products to consumers at various prices. What is the Law of Supply :…
Class 11 and Class 12 commerce students, and CA Foundation aspirants, studying Economics Class 11.
Yes — this page includes a short interactive quiz so you can check your understanding straight away.