Engel curve is the locus of points showing equilibrium quantities of a commodity at different levels of income of the consumer.
What is an Engel Curve :
It is the locus of all the points showing equilibrium purchase patterns with a change in income, keeping prices of commodities and preferences of consumers constant. This curve describes how consumers purchases change with the change in their income and expenditures. It depends upon consumer’s characteristics and his demographic variables.
Engel curve is the term propounded by Eminent German Scholar Ernest Engel. He defines this term as,
“An Engel curve is a locus of points relating to the equilibrium quantity of the same good and level of money income.”
In other words, It indicates, how much quantity of a commodity, a consumer will consume at different levels of income in order to be in equilibrium.
Graphical Representation:

In fig, X-axis shows the quantity of a commodity and Y-axis shows the income of the consumer. At the income level of OM, the quantity demanded of the commodity is OP units. As the income level increases to ON, the quantity demanded increased to OQ units. Here, the points A and B indicate the level of consumer equilibrium. By joining these points, we get the EE curve, that is known as the Engel Curve.
The slope of the Engel Curve:
The slope of this curve can be
- Positive Slope
- Negative Slope
Positively Sloped Engel Curve :
The slope of this curve is positive in the case of normal goods. It means, that the expenditure of consumer increases with the increase in income. Here, income and expenditure are positively related to each other. The slope of this curve in case of normal goods can be classified as:
a) In case of necessity goods:
These curves are positively sloped in case of necessity goods. Here, with an increase in income, there is less than proportionate increase in quantity purchased by the consumer. Hence, the curve bends towards Y-axis showing its slope.

In fig, the quantity purchased of a commodity (necessity goods) is shown on X-axis and income is shown on Y-axis. At OM level of income, the quantity purchased is OP units. As the income increases to the ON level, the quantity demanded increased to OQ units which is less than proportionate change in income. Here, the points A and B indicate the points of consumer equilibrium. By joining these points, we get the Engel curve EE. It is clear from this curve that as the income level of consumer increases, the quantity of commodity rises at a diminishing rate. It implies the effect of change in income on the expenditure of consumer in the case of necessity goods.
b) In the case of luxury goods:
In the case of luxury goods too, these curves are positively sloped. Here, with an increase in income, there is less than proportionate increase in quantity purchased by the consumer. Therefore, the curve bends to X-axis showing its slope.
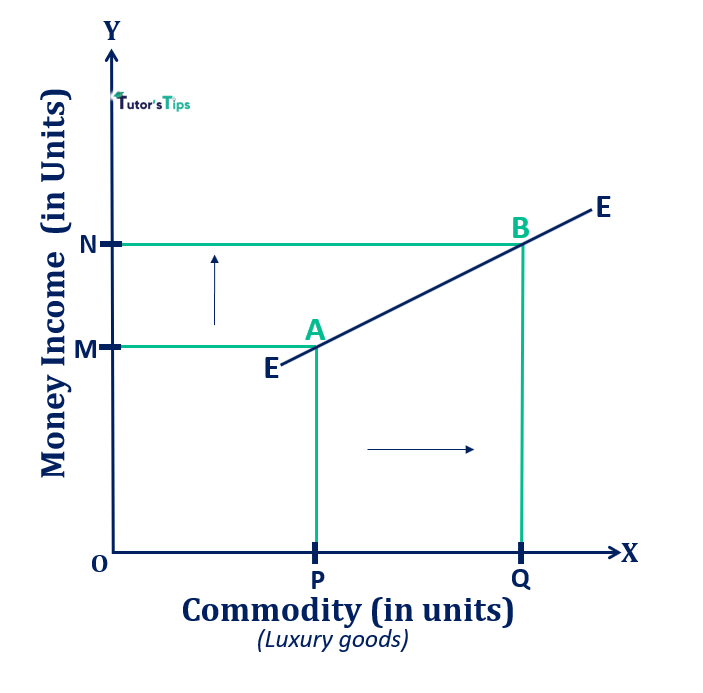
In fig, the quantity demanded of commodity especially luxury goods is shown on X-axis and Y-axis shows the different levels of income of the consumer. At the income level of OM, the consumer demands the OP units of the commodity. When the income level of the consumer increases to ON, the quantity demanded increases to OQ units. Here, the points A and B represents the level of consumer equilibrium.EE is the Engel curve. In this, the proportionate change in quantity is more than proportionate change in income. Therefore, this is a graphical representation of the EC in the case of luxury goods.
Negatively Sloped Engel Curve :
The slope of this curve is negative in the case of inferior goods. It means, that the expenditure of consumer decreases with the increase in income. Here, income and expenditure are inversely related to each other.

The above fig. represents the Engel curve in the case of inferior goods. In fig, X-axis shows the quantity demanded of a commodity (mainly inferior goods) and Y-axis shows the income levels of consumer. At OM level of income, the consumer is demanding OP units of the commodity. As the income increases to the ON level, the quantity demanded by the consumer decreased to OQ units. Here, the points A and B depicts the consumer equilibrium points. EE is the Engel Curve. In this, quantity demanded of commodity and income, are inversely related to each other.
Derivation of Engel Curve from ICC:
As the demand curve shows the relationship between price and quantity purchased, other things remaining constant. Similarly, the Engel curve shows the relationship between quantity purchased and income of consumer, other things like prices and preferences of consumers remaining constant.
To derive the EC from Income Consumption Curve, firstly, we have to draw the ICC curve at different income levels. Given the preferences of consumers and prices of commodities, the ICC curve is drawn to show the equilibrium points. Then, by plotting income on Y-axis and quantity of a commodity on X-axis, the relationship between income and quantity purchased is shown by the Engel curve. Any point on the Engel curve corresponds to the relevant point on the ICC curve.
Derivation through Graphical Representation:
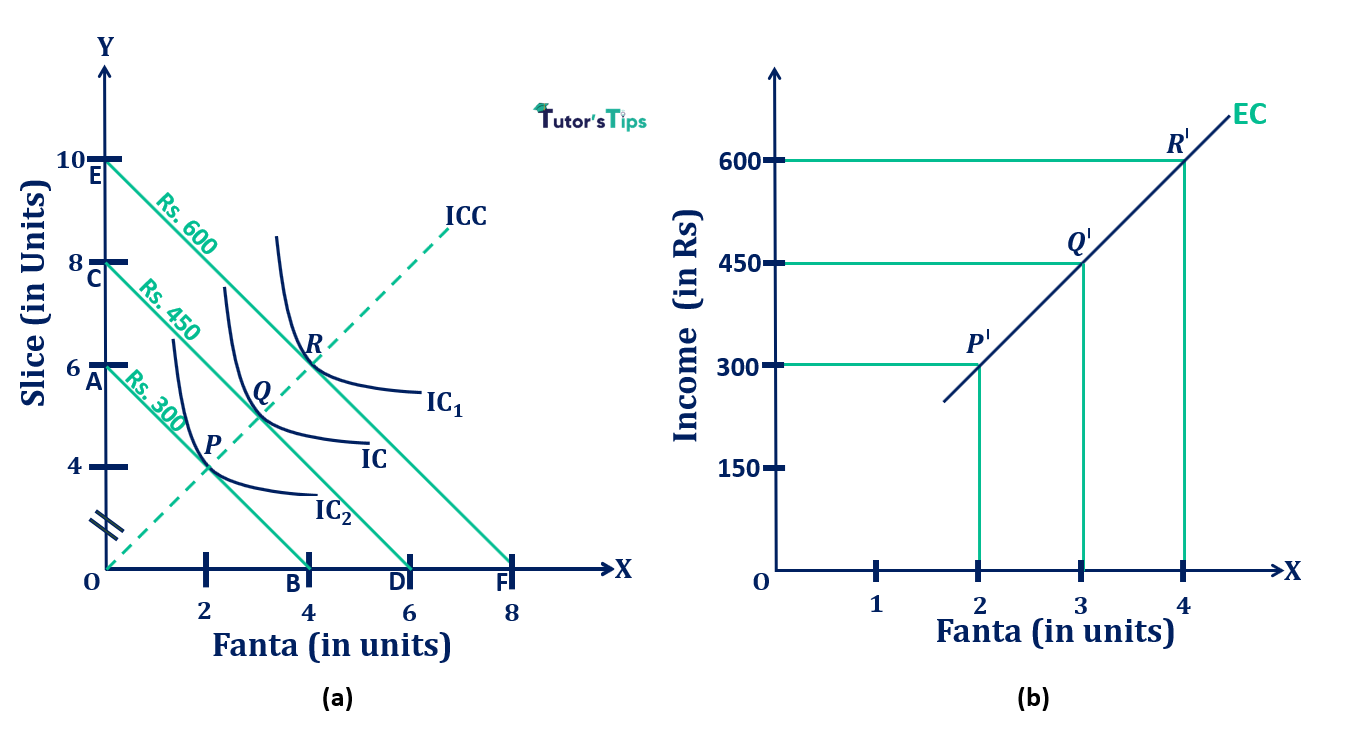
In Fig, (a) shows the ICC curve with equilibrium points. Here, X-axis and Y-axis represent the quantity of cold-drinks Fanta and Slice respectively. AB is the budget line with a budget of Rs.300 and IC curve is the indifference curve showing maximum satisfaction to the consumer. There, the consumer is able to buy 2 units of Fanta and 4 units of Slice represented by the equilibrium point P.
When the income of the consumer increases to Rs.450, the CD is his new budget line shifting to the right from the previous one and IC1 is a new indifference curve. Here, he becomes able to buy 3 units of Fanta and 5 units of Slice and Q is the new equilibrium point of the consumer. Similarly, when the income of the consumer increases to Rs.600, the budget line and indifference curve shift to EF and IC2. Here, he becomes able to purchase 4 units of Fanta and 6 units of Slice and consumer gets new equilibrium point as R. And, ICC is the curve drawn by joining the equilibrium points P, Q and R.
To derive the Engel curve from this ICC curve,
we have to plot the quantity of one commodity(here, Fanta) on X-axis and income on Y-axis as shown in (b). At the income level of Rs.300, the quantity of Fanta purchased by the consumer is 2 units. As shown in (a), with an increase in budget to Rs.450 results in an increase in the quantity of Fanta to 3 units. Thus, we will plot 3 units of Fanta at the income level of Rs.450. Similarly, by observing the quantity of Fanta at an increased level of Rs.600, we will plot the 4 units of Fanta corresponds to the income level of Rs.600.
Thus, the equilibrium points on the ICC curve in indifference map have been changed into the Engel curve showing the income-expenditure relationship. Any point on this curve indicates corresponding relevant points on the ICC curve. As, P’, Q’ and R’ points on the Engel curve corresponds to P, Q and R point on ICC curve. Here, the slope of the Engel curve is upward sloping as it is assumed that the commodity is a normal commodity and the quantity purchased is increasing with an increase in income.
Thanks!!
Please share with your friends
Comment if you have any question.
References:
Introductory Microeconomics – Class 11 – CBSE (2020-21)