Indifference curve shows the different combinations of two commodities offering the same level of utility to the consumer.
What is Indifference Curve?
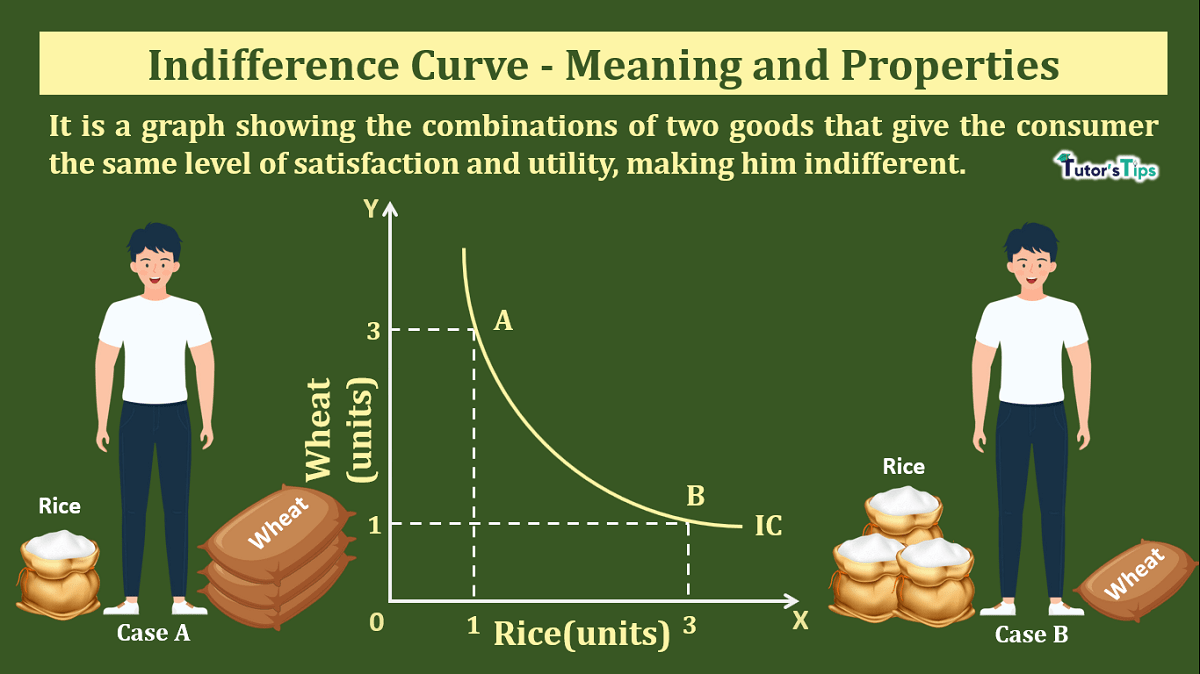
It is a graph showing the combinations of two goods that give the consumer the same level of satisfaction and utility, making him indifferent. Indifference curves are used to show the consumer’s preferences and demand patterns for individual consumers over different commodities.
In other words, the indifference curve connects the points on a graph where a consumer is indifferent to buy two commodities. On any point on this curve, the consumer is getting the same level of satisfaction by consuming a combination of two commodities.
Subscribe our Youtube Channel
Definitions:
According to Leftwich,
“A single indifference curve shows the different combinations of X and Y that yield equal satisfaction to the consumer.”
In the words of Ferguson,
“An indifference curve is a combination of goods, each of which yields the same level of total utility to which the consumer is indifferent.”
According to Koutsoyiannis,
“An indifference curve is the locus of points- particular combinations of good-which yield the same utility to the consumer so that he is indifferent as to the particular combination he consumes.”
Indifference Set
It is a set of combination of two goods offering the same level of satisfaction to consumers. A consumer is indifferent across all combinations of goods in indifference set. It is also known as indifference schedule in economics.
According to Meyers,
“An indifference schedule may be defined as a schedule of various combinations of goods that will be equally satisfactory to the individual concerned.”
In other words, indifference set refers to the tabular representation of the combination of two goods giving the same utility or satisfaction to consumers. When this set is plotted on the graph, it will be known as the indifference curve.
Indifference Map:
The collection of indifference curves over different utility levels on the graph is known as the indifference map. It shows the different combinations of two commodities which yield equal satisfaction to the consumer. Different indifference curves are used to indicate lower and higher levels of satisfaction of different combination of two goods.
In other words, when the different indifference curves or family of indifference curves are shown in a diagram, it is called indifference map.
Illustration:
The following indifference set shows the different combinations of wheat and rice that yield customer equal satisfaction.
| Combination of Wheat and Rice | Wheat(in units) | Rice (in units) |
| A | 10 | 5 |
| B | 7 | 6 |
| C | 5 | 7 |
| D | 4 | 8 |
The above set shows that the consumer gets equal satisfaction by consuming all four combinations A, B, C and D of wheat and rice. In combination A, the consumer has 10units of wheat and 5 units of rice, in combination B he has 7units of wheat and 6 units of rice, in combination C he has 5 units of wheat and 7 units of rice and in combination D he has 4 units of wheat and 8 units of rice. In order to have one more unit of rice, the consumer sacrifices some quantity of wheat in such a way that there is no change in the level of satisfaction out of each combination.
Graphical Representation:

In fig, X-axis shows the quantity of rice and Y-axis shows the quantity of wheat. IC is the indifference curve. The points A, B, C and D on the IC curve indicate those combinations of rice and wheat which yield equal satisfaction to the consumer. This curve is also known as Iso-utility curve.
Properties of Indifference Curve:
1. IC slopes downward:
It slopes downward from left to right. It implies that its slope is negative. This is because of the assumption that if the consumer decides to have more of one commodity, he must consume less quantity of others. then, only he can get equal satisfaction from their different combinations. For example, in fig, the consumer will get equal satisfaction at all points on the indifference curve. In combination A, the quantity of wheat is more than rice. Similarly, in combination D, the quantity of rice is more than wheat. Consequently, the slope of the indifference curve will invariably be downward sloping negative curve.
2. IC is convex to the origin:
An indifference curve is generally convex to the point of origin. This property is based on the law of marginal substitution which states that as a consumer gets more and more unit of commodity X, he will be willing to give up less and fewer units of Y so that the level of satisfaction of consumer remains the same.
For instance, in the graph showing the indifference curve is convex to the origin. It signifies that the marginal rate of substitution of rice for wheat is declining. It means as the consumer gets more and more units of rice, he parts with fewer units of wheat. This situation conforms to real life. Consequently, an indifference curve is convex to the point of origin.
3. IC curves never cut each other:
Each indifference curve represents a different level of satisfaction, so they cant intersect each other. It is not possible that two curves with different satisfaction levels cut each other at any point. If two curves intersect each other at a point, it implies that both curves contain the same level of satisfaction at that point which is not logical.
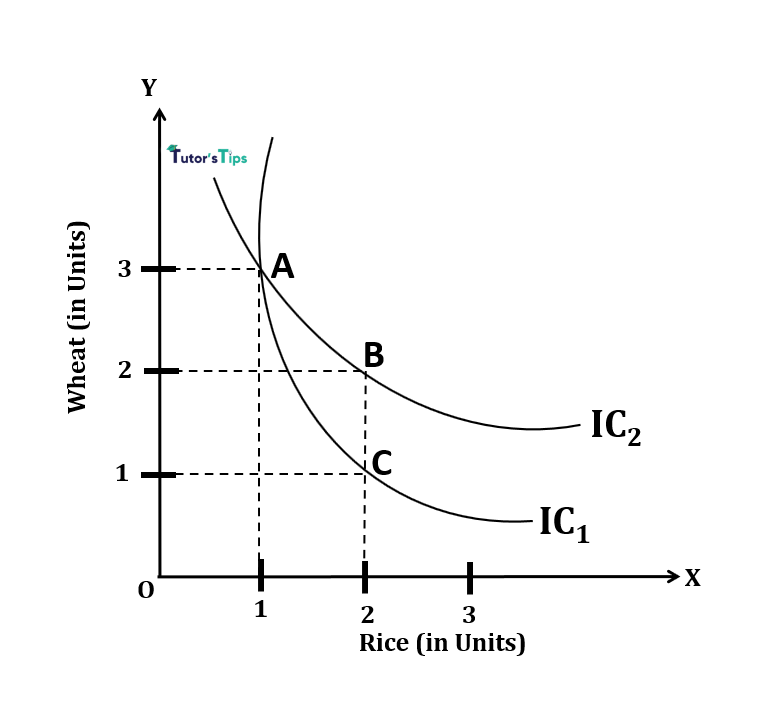
In fig, the two curves IC1 and IC2 intersect each other at point A, which is not possible. Points A and C on indifference curve IC1 represents the combination yielding equal satisfaction i.e. Satisfaction from A combination= Satisfaction from C combination. Likewise, A and B points on indifference curve IC2 represents equal satisfaction i.e. Satisfaction from A combination= Satisfaction from B combination. It implies satisfaction from all A, B and C combinations are the same. But it is not possible as the quantity of wheat in B combination is more than in combination C. Although, the quantity of rice is the same.
4. Higher indifference curve represents more satisfaction:
Indifference map, higher the indifference curve, higher is the satisfaction and lower indifference curve shows the low satisfaction.
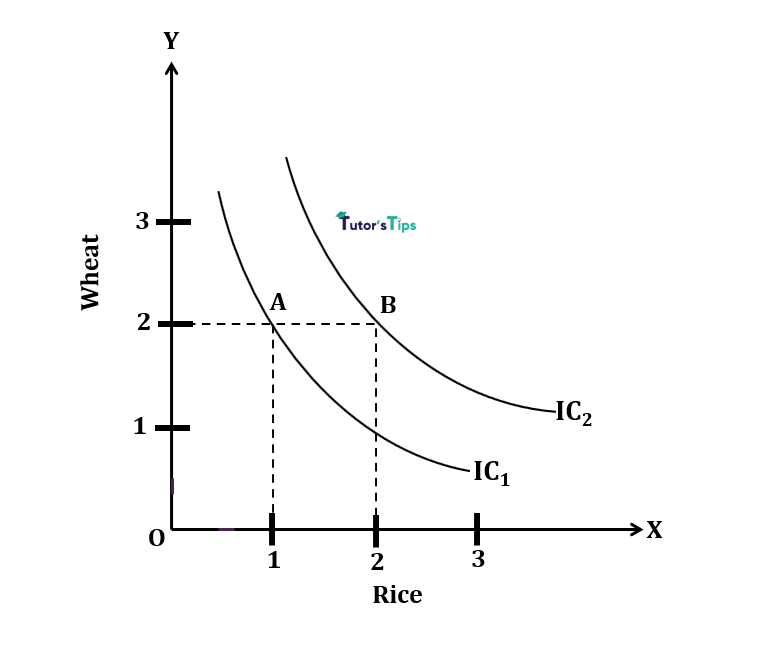
In fig, IC2 is higher and IC1 is a lower indifference curve. Point B on IC2curve represents more units of rice than point A on IC1. Although the units of wheat remain same in both combinations. Hence, point B represents more satisfaction than point B. Thus, a higher indifference curve implies higher satisfaction.
5. IC neither touches X-axis or Y-axis:
It is assumed that the consumer consumes the combination of different quantities of two goods. Hence, the indifference curve never touches the X or Y-axis. If in case, any indifference curve touches the axis, it implies that only one commodity is consumed by the consumer and demand for other commodity is zero. It may touch Y-axis if Y-axis represents money instead of a commodity.
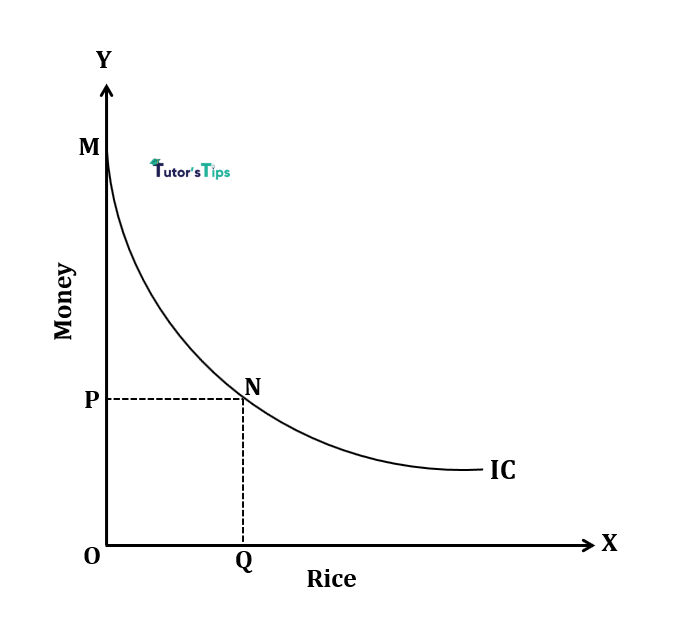
In fig, the indifference curve touches Y axis at point M which implies that when the customer has OM quantity of money at which he doesn’t want any unit of rice. At point N, he is willing to buy OQ quantity of rice with OP units of money. This combination will yield him the same satisfaction as by keeping OM units of money.
6. IC need not be parallel to each other:
Indifference curves may or may not be parallel to each other. It depends upon the marginal rate of substitution of two curves on the indifference map. If the marginal rate of substitution of different points decreases at a constant rate, then curves are parallel to each other, otherwise, they are not parallel.
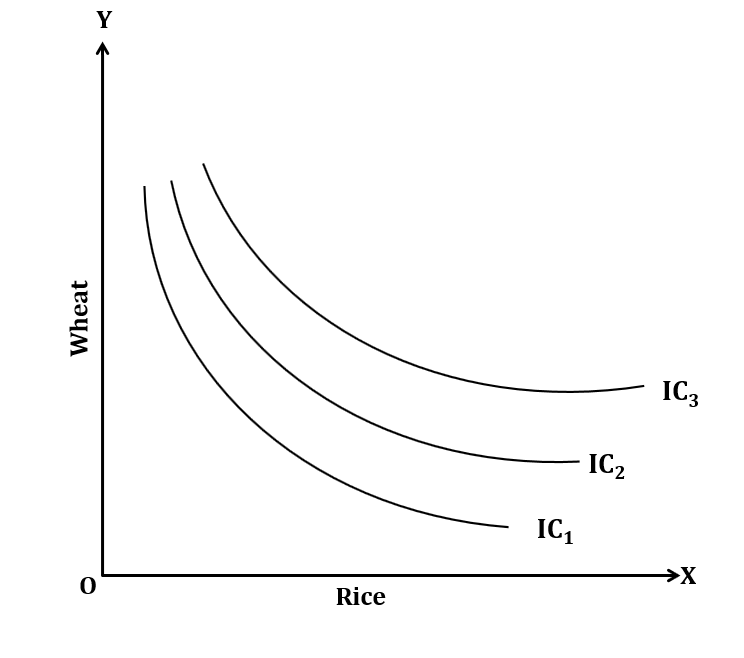
In fig, IC1, IC2 and IC3 show different combinations of rice and wheat by a consumer. Each curve represents the same level of satisfaction. These curves are not parallel to each other as it all depends upon the marginal rate of substitution of curves.
Thanks Please share with your friends
Comment if you have any question.
References:
Introductory Microeconomics – Class 11 – CBSE (2020-21)