Loading Tutorstips...
✦ FREE LEARNING — CLASS 11 & 12 — CBSE · PSEB — ACCOUNTS · ECONOMICS · BST ✦
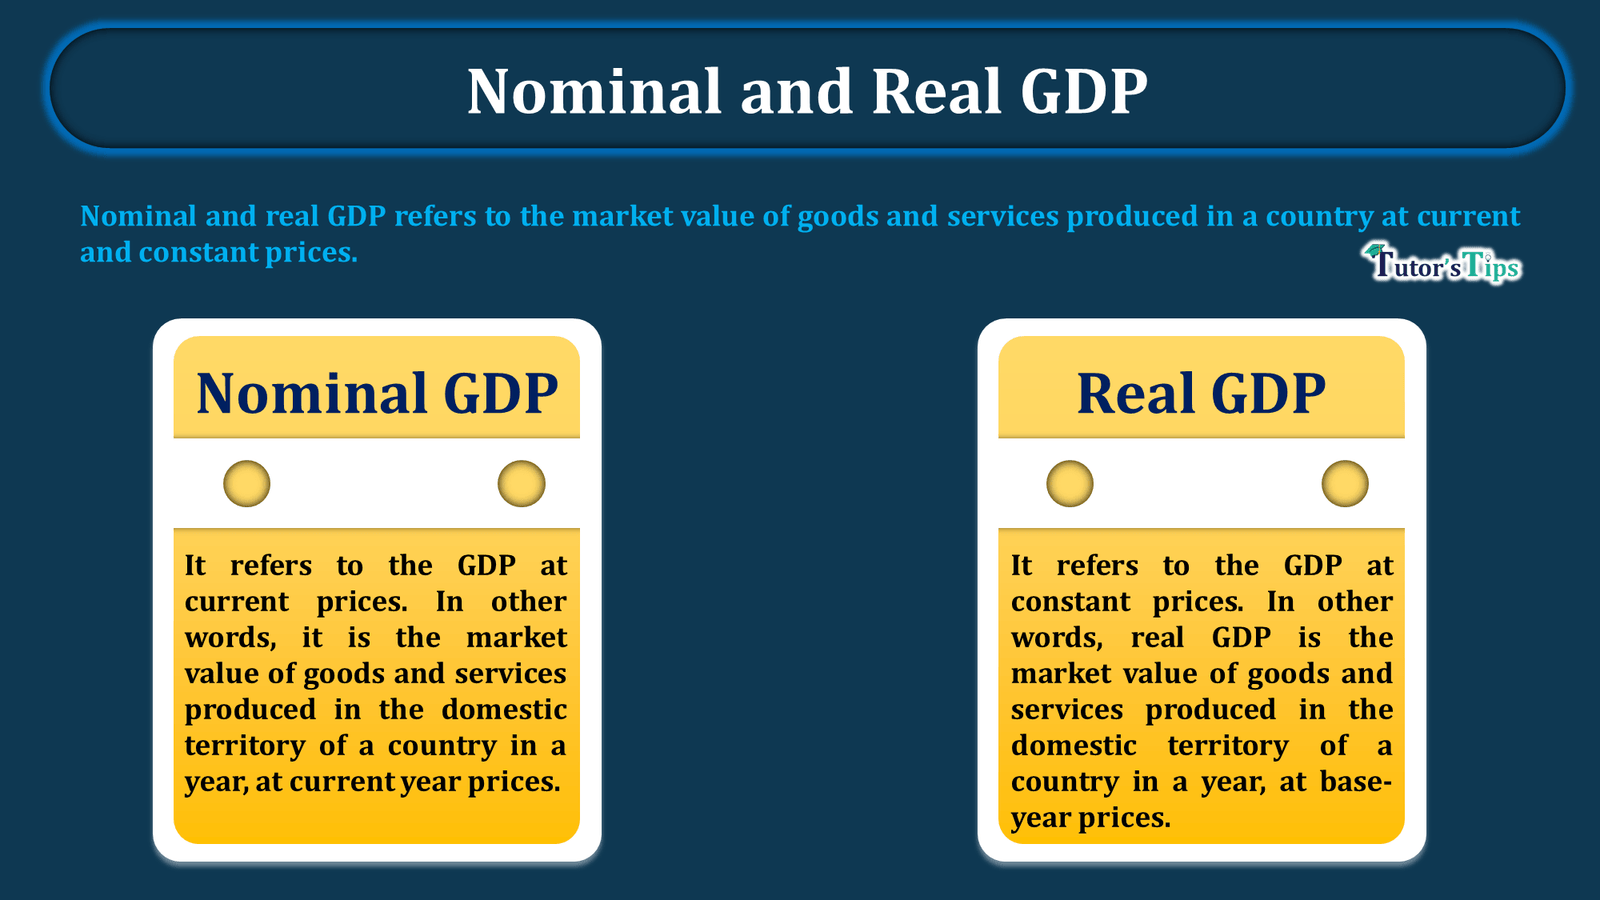
Nominal and real GDP refers to the market value of goods and services produced in a country at current and constant prices.
It refers to the GDP at current prices. In other words, it is the market value of goods and services produced in the domestic territory of a country in a year, at current year prices. Or, we can say, it denotes the GDP at the prices which are prevailing during the year of estimation of GDP.
It can be calculated as:
Nominal GDP = Q × P
here,
Q = quantity of goods and services produced during an accounting year
P = price prevailing during an accounting year
This represents that the nominal GDP can increase when there is an increase in either quantity or prices. In other words, if the quantity of goods and services in domestic territory increases, provided the current prices are constant, the nominal GDP increases. On the other hand, if the prices increases, assuming the quantity of produced goods and services is constant, the same will increase. Thus, we can say, it is merely a monetary increase in GDP. It doesn't represent real increase in the GDP or the increase in the flow of goods and services in an economy. In short, it only causes money illusion- the higher market value of the output in an economy.
The following table shows the estimation of nominal GDP with the assumptions:
A) an economy produces wheat, rice and sugar only.
B) output of economy remains constant.
| Year | Items | Quantity | Price | GDP at market price(in crores) |
| 2015-16 | Rice | 15 tonnes | Rs. 750per tonne | 11,250 |
| Wheat | 20 tonnes | Rs.1000 per tonne | 20,000 | |
| Sugar | 10 tonnes | Rs.2500per tonne | 25,000 | |
| Total Market value (Nominal GDP) | 56,250 |
| Year | Items | Quantity | Price | GDP at market price(in crores) |
| 2020-21 | Rice | 15 tonnes | Rs. 1500 per tonne | 22,500 |
| Wheat | 20 tonnes | Rs.2000 per tonne | 40,000 | |
| Sugar | 10 tonnes | Rs.5000 per tonne | 50,000 | |
| Total Market value (Nominal GDP) | 112,500 |
The above table shows the increase in nominal GDP from Rs.56,250 to Rs.112,500 crores when the quantity of goods and services produced in the economy is constant. Thus, t is a situation of monetary increase as the money value of commodities rises, but the quantum of output is constant.
It refers to the GDP at constant prices. In other words, real GDP is the market value of goods and services produced in the domestic territory of a country in a year, at base-year prices. here, the base year is the year of comparison. Or, it is the year when macro variables i.e. price and quantity are expected to be within their normal range.
Thus,
Real GDP =Q × P*
here,
Q = quantity of goods and services produced during an accounting year
P* = price prevailing during the base year
In this case, the prices are always constant. Thus, the GDP will increase only when there is an increase in output. So, an increase in real GDP represents an increase in the flow of goods and services in the economy only. Or, we can say, higher the level of GDP, the higher the availability of goods and services for the residents in the country, assuming other things constant. In short, it implies the improvement in the quality of life in a country.
The following table shows the estimation of real GDP with the assumptions:
A) an economy produces wheat, rice and sugar only.
B) prices of commodities in an economy remains constant.
| Year | Items | Quantity | Price | GDP at market price(in crores) |
| 2015-16 | Rice | 15 tonnes | Rs. 750per tonne | 11,250 |
| Wheat | 20 tonnes | Rs.1000 per tonne | 20,000 | |
| Sugar | 10 tonnes | Rs.2500per tonne | 25,000 | |
| Total Market value (Real GDP) |
56,250 |
| Year | Items | Quantity | Price | GDP at market price(in crores) |
| 2020-21 | Rice | 30 tonnes | Rs. 750per tonne | 22,500 |
| Wheat | 30 tonnes | Rs.1000 per tonne | 30,000 | |
| Sugar | 20 tonnes | Rs.2500per tonne | 50,000 | |
| Total Market value (Real GDP) | 102,500 |
The above table shows the increase in real GDP from Rs. 56250 to Rs.102,500 crores linked to rising in output as prices are constant.
In short, the index of real GDP reflects a change in the output, while the index of nominal GDP may or may not. That is why real GDP is considered a better index of economic growth than nominal GDP.
Economics Educator
Mrs. Dilgeerjot Kaur holds a B.Com and M.Com degree and has over 9 years of teaching experience in microeconomics, macroeconomics, and business economics.
This guide covers "What is Nominal and Real GDP - Explained with examples", focusing on key definitions, step-by-step concepts, applications, and revision guidelines relevant to Economics Class 12.
It is primarily curated for Class 11 and Class 12 high school commerce, accounting, and economics students, as well as aspirants preparing for board exams or CA Foundation.
You can take our custom-built interactive practice quiz directly on this page to test your understanding of "What is Nominal and Real GDP - Explained with examples" instantly.