The theory of supply is the economic relationship between the number of goods and services supplied by sellers and their prices at a given period of time.
What is the theory of Supply?
Supply refers to anything in demand that is sold in a competitive marketplace. It mainly refers to goods, services, and labor. The price of goods, price of related goods, and price of inputs affect the supply as these contribute to the overall cost of goods sold.
Terms related to the theory of supply:
The theory of supply is related to the following terms:
- Supply Schedule
- Supply Curve
Supply Schedule :
It is a tabular representation of the correlation between the price of a commodity and its quantity supplied for a given period of time. It has two aspects :
a) Individual Supply Schedule :
It is defined as the tabular representation of different quantities of commodities a seller is offering to sell at different price levels during a given period of time.
The following table shows the supply schedule of commodity ‘X’:
| Price of Commodity (in Rs) | Quantity Supplied (in Units) |
| 30 | 05 |
| 40 | 10 |
| 50 | 15 |
| 60 | 20 |
| 70 | 25 |
As shown in the above schedule, the quantity supplied of Commodity’X’ increases with an increase in price. The seller can sell 5 units at the price of Rs.30. When the price increases to Rs 40, the seller increases the supply to 10 units. Similarly, as the price rises, the quantity supplied increases keeping other factors constant.
Market Supply Schedule :
It is a tabular statement showing different quantities of a commodity that all sellers are offering to consumers at different prices in the market during a given period of time.
Following is the supply schedule of Commodity ‘X’ by individual ‘P’ and individual ‘Q’ and market supply :
| Price of Commodity (in Rs) |
Quantity Supplied by ‘P’ |
Quantity Supplied by ‘Q’ (in units) |
Market Supply(P+Q) (in units) |
| 30 | 5 | 10 | 15 |
| 40 | 10 | 15 | 25 |
| 50 | 15 | 20 | 35 |
| 60 | 20 | 25 | 45 |
| 70 | 25 | 30 | 55 |
As shown in the schedule, at price Rs 30, the quantity supplied by P is 5 units of commodity ‘X’ whereas the quantity supplied by Q is 10 units which results in 15 units as market supply. As price increase to Rs 40, the quantity supplied by P and Q rises to 10 and 15 units respectively and the market supply reaches 25 units. Similarly, the price goes on increasing, the market supply keeps on rising.
Supply Curve :
It is a graphical representation of the correlation between the price of the commodity and quantity supplied for a given period of time.
Individual Supply Curve :
It refers to the graphical representation of corresponding quantities supplied by an individual seller of a particular commodity at different price levels. It is the locus of all those points showing various quantities of a commodity that a seller is ready to sell at various prices during a given period of time.
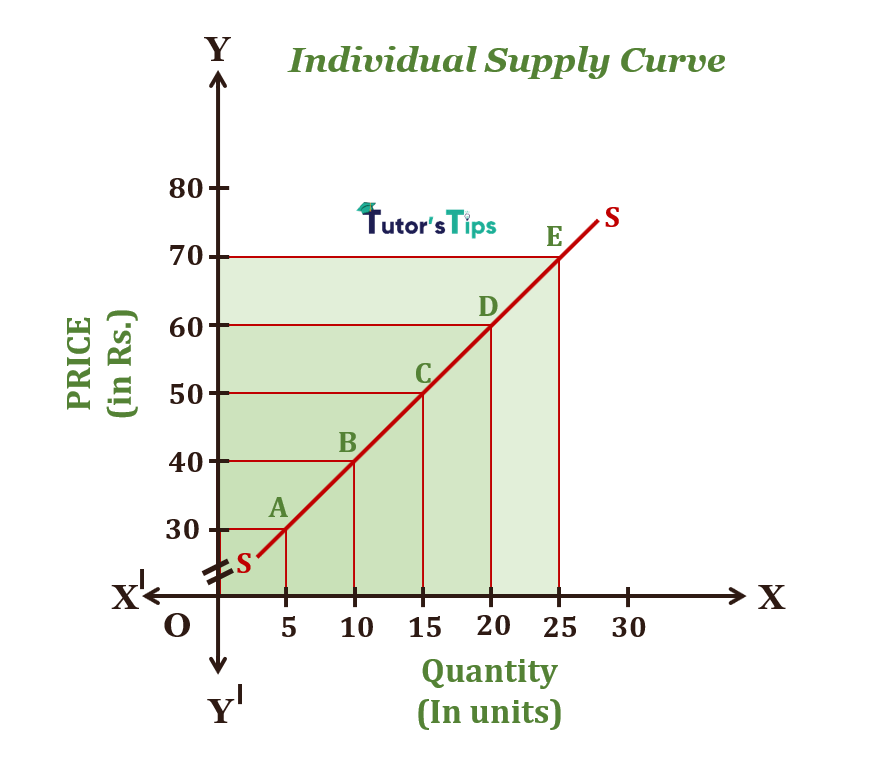
In the above graph, X-axis shows the quantity and Y-axis shows the price. The points A, B, C, D, and E defines the relationship between price and quantity. SS is the supply curve. It has a positive slope meaning thereby that as price rises, the supply extends. It is evident that at a price less than Rs. 30, the seller is not prepared to sell any unit. The price below which the seller is not prepared to sell any unit is known as Reserve Price or Minimum Supply Price.
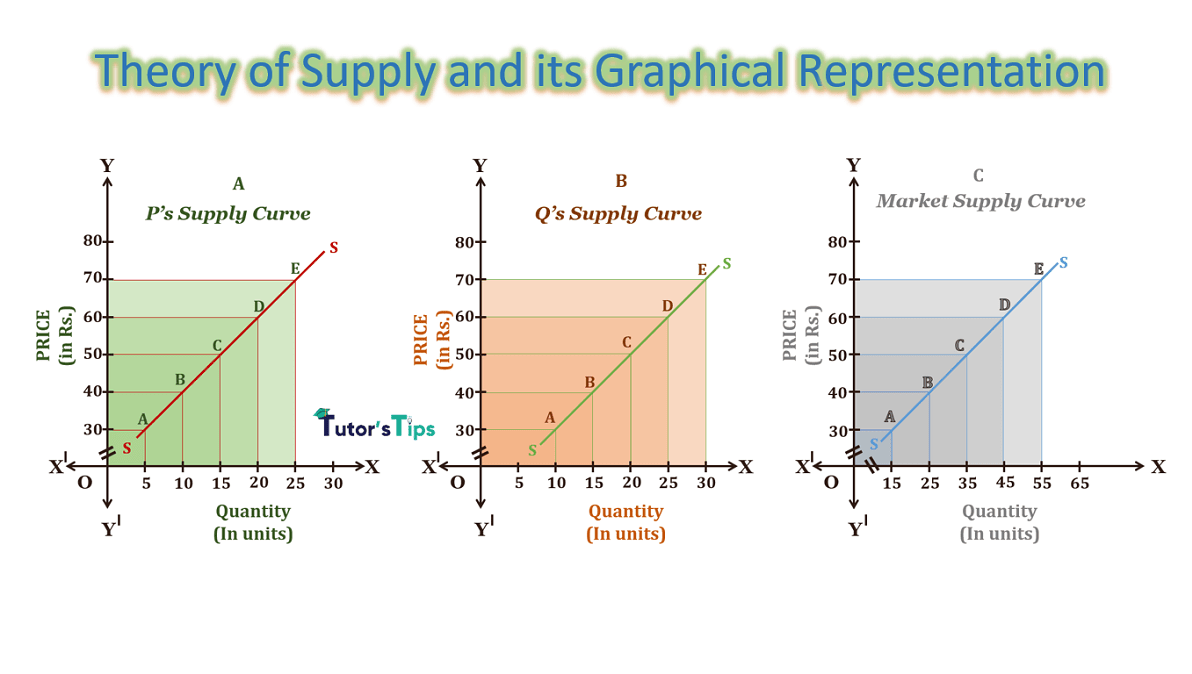
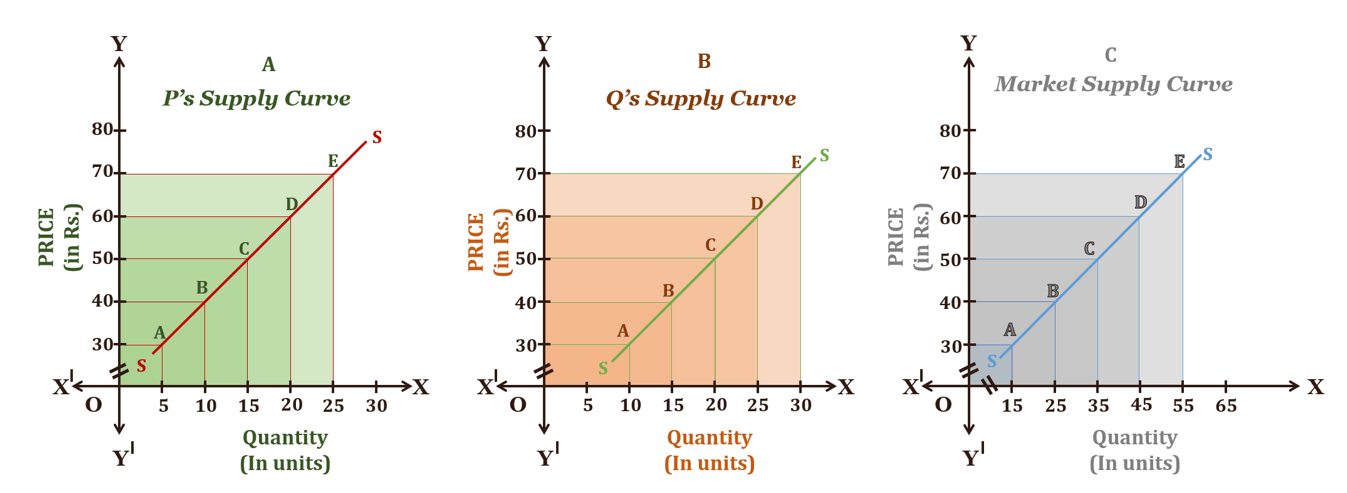
Market Supply :
It refers to the summation of individual supply curves in the market. In other words, it is the graphical representation of the total of all individual supply for a specific commodity in the market and various price levels.
Why Supply Curve Upward Sloping:
The supply curve is always upward sloping as there is a positive relationship between the price of a commodity and its quantity supplied. The reasons for the upward-sloping supply curve:
1) Profit as a motive: When the market price increases in the market following a rise in demand, the sellers tend to increase their output. It results in an increase in supply as well as profits.
2)Production and Costs: When the seller expands its output to increase the supply, the firm’s cost of production tend to increase which results in higher prices to cover those extra costs. This may be due to the law of diminishing returns as more inputs are engaged in production.
3)New entrants in the market: High prices works as an incentive for newcomers in the market. Thus, it leads to an increase in supply in the market.
Thanks!!!
Please share with your friends
Comment if you have any questions.
References:
Introductory Microeconomics – Class 11 – CBSE (2020-21)