Loading Tutorstips...
✦ FREE LEARNING — CLASS 11 & 12 — CBSE · PSEB — ACCOUNTS · ECONOMICS · BST ✦
Production Possibility curve refers to the curve showing alternative possible combinations of two goods which can be produced with given resources.
It is a curve showing different production possibilities of two goods with the given resources and technique of production. Also, this curve shows the limit of what it is possible to produce with available resources. Therefore, It is also known as Production Possibility Boundary or Production Possibility Frontier.
This curve is also called Transformation Line or Transformation Curve because it indicates that if more of a commodity is to be produced then factors of production will have to be withdrawn from the production of another commodity. In other words, one commodity is transformed into another.
In the words of Samuelson,
"Production Possibility Curve is that curve which represents the maximum amount of a pair of goods or services that can be produced with an economy's given resources and technique assuming that all resources are fully employed."
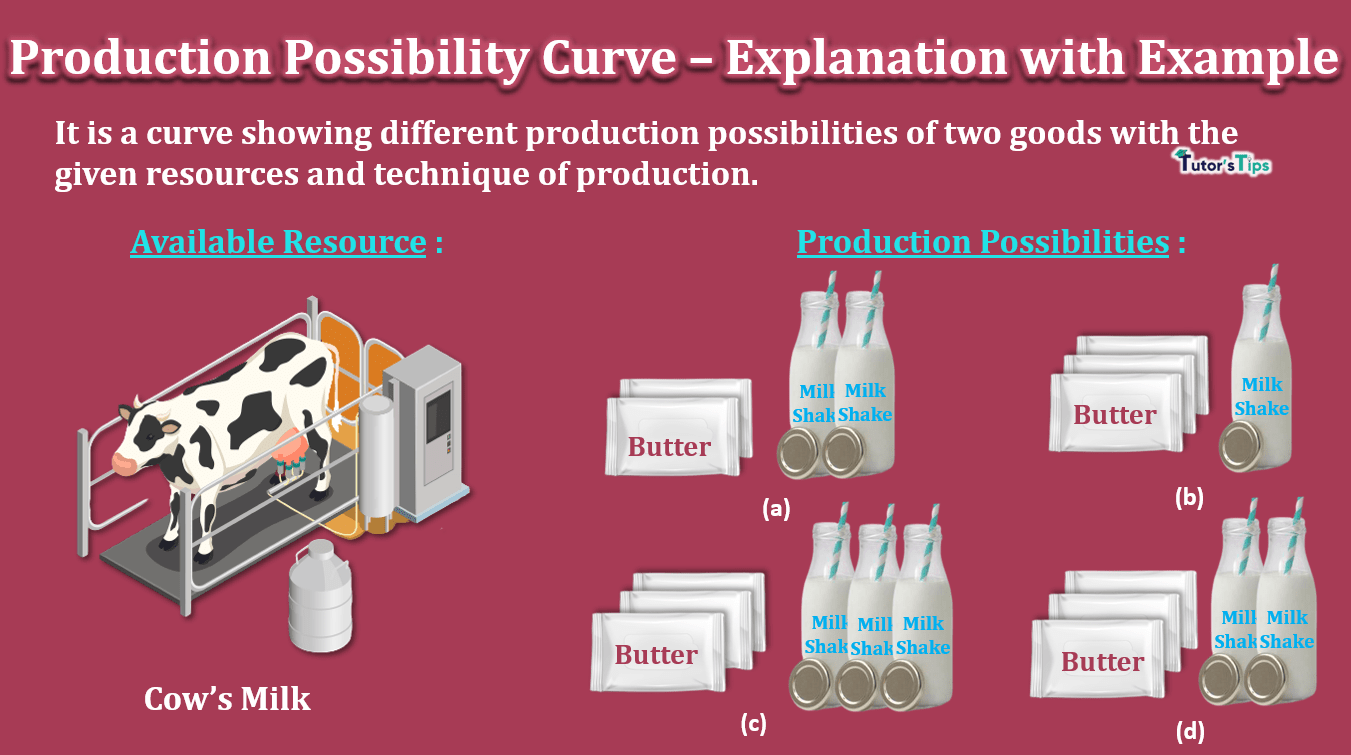
Suppose, a producer decides to produce only two goods namely, milkshake and butter with the available resource "cow's milk" and given technology. If all the resources are used for making milkshake alone, then 500 bottles of milkshake can be produced. On the other hand, if all the resources are used for the production of butter only, then 250 units of butter can be produced. Moreover, If the producer produces both the goods, then within these limits, various combinations can be produced.
| Production Possibilities/ Goods | Milk-Shake (in units) | Butter (in units) |
| A | 500 | 0 |
| B | 450 | 50 |
| C | 360 | 100 |
| D | 270 | 150 |
| E | 150 | 200 |
| F | 0 | 250 |
The above schedule shows that if production is carried out under 'A' combination, then 500 units of Milk-shake alone will be produced without any production off butter. On the other hand, if production is obtained under 'F' combination, then 250 units of butter will be produced without any production of milk-shake. Besides these limits, there are many alternatives possibilities of production of milkshake and butter. For instance, under 'B' combination, it is 450 units of milkshake and 50units of butter; under 'C' combination, it is 360 units of milkshake and 100 units of butter; under 'D' combination, it is 270 units of milkshake and 150 units of butter and under 'E' combination, it is 150 units of milkshake and 200 units of butter.
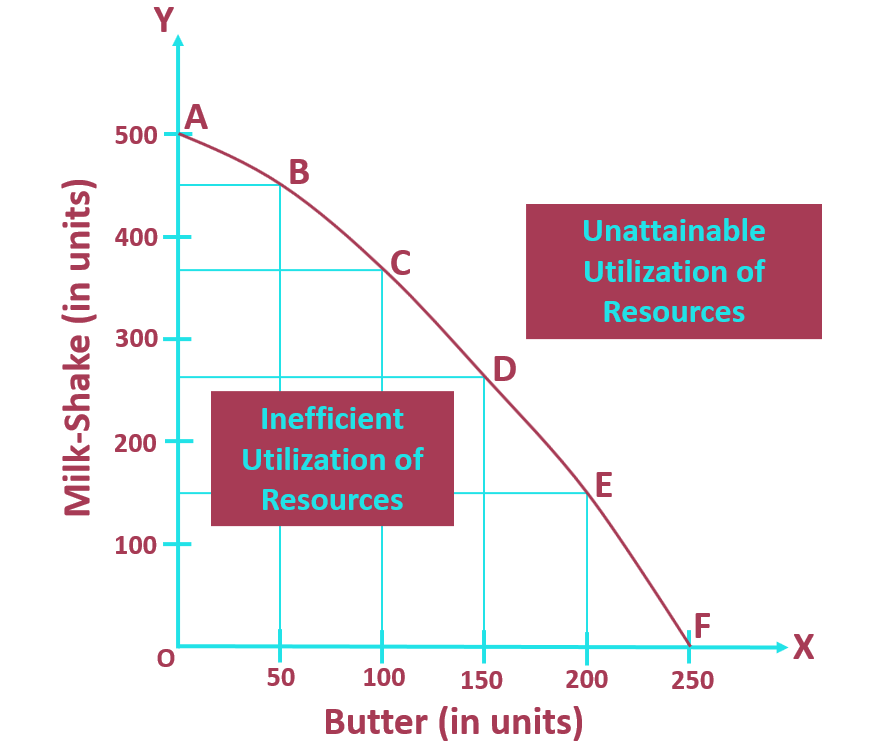
In fig, the quantity of butter is shown on X-axis and milkshake on Y-axis. Here, The first production possibility is 500 units of milkshake and no butter. In fig, This is marked as point A. Similarly, points B, C, D and E show different combinations of butter and milkshake. Lastly, Point F shows the production possibility of 250 units of butter and no milkshake. By combining these points, we get AF curve. This curve is known as the Production Possibility or Transformation curve. Furthermore, The area beyond this curve represents unattainable combinations and area inside the curve shows the inefficient utilization of resources.
Production Possibility Curve has the following basic properties :
Economics Educator
Mrs. Dilgeerjot Kaur holds a B.Com and M.Com degree and has over 9 years of teaching experience in microeconomics, macroeconomics, and business economics.
This guide covers "Production Possibility Curve-Explanation with Example", focusing on key definitions, step-by-step concepts, applications, and revision guidelines relevant to Economics Class 11.
It is primarily curated for Class 11 and Class 12 high school commerce, accounting, and economics students, as well as aspirants preparing for board exams or CA Foundation.
You can take our custom-built interactive practice quiz directly on this page to test your understanding of "Production Possibility Curve-Explanation with Example" instantly.