Loading Tutorstips...
✦ FREE LEARNING — CLASS 11 & 12 — CBSE · PSEB — ACCOUNTS · ECONOMICS · BST ✦
The law of demand is the explanation of the relationship between price and quantity demanded of the commodity.
The Law of demand expresses the relationship between price and quantity demanded of a given commodity. It states that “ the quantity demanded increases with a fall in price and diminishes with rising in price, other things being equal.” This happens because of the law of diminishing marginal utility.
Thus, it shows the inverse relationship between quantity demanded of a given commodity and its price. This law defines the direction in which quantity demanded changes with a change in price. The ‘ other things’ includes all those factors which influence the demand such as the income of consumer, price of related goods, tastes of consumer and fashion etc.
Subscribe our Youtube Channel
According to Prof. Marshall, “ The law of demand states that amount demanded increases with fall in price and diminishes when price increases.”
According to Benham, “ Usually a larger quantity of commodity will demand at a lower price than a higher price.”
According to Ferguson, “According to the law of demand, the quantity demanded varies inversely with price.”
For example, when the price of 1 kg of mangoes goes down from Rs.80 to Rs. 50, the quantity demanded will go up. Many people who were not able to buy at Rs.80, are now able to purchase at Rs 50.
Similarly, if local Starbucks raises the price of coffee from Rs 700 to Rs. 1000, the quantity demanded will be decreased. Fewer people will buy their coffee, rather they prefer to make their own at home because of the increased price.
The law of demand can be illustrated with the help of the demand schedule and demand curve. These are shown as follows: -
The following schedule shows the series of prices and the quantity demanded ice cream respectively:
|
PRICE OF ICE CREAM |
QUANTITY DEMANDED |
|---|---|
|
50 |
2 |
|
40 |
4 |
|
30 |
6 |
|
20 |
8 |
|
10 |
10 |
The above table shows that when the price of Rs 50, there were 2 units of ice cream demanded. As the price goes down to Rs 40, the quantity demanded increases to 4 units. Similarly, the decline in price to Rs.30, 20, 10 follows an increase in quantity demanded as 6, 8 and 10 units respectively.
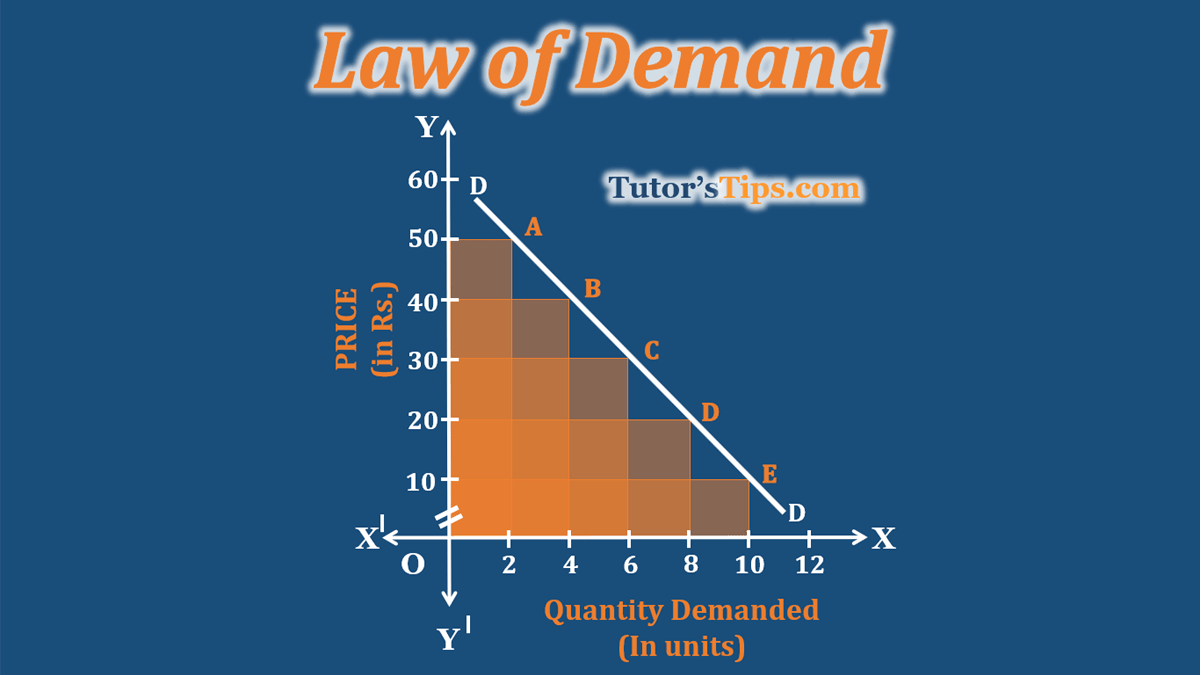
The following graph shows the relationship between price and quantity demanded as Demand of Law expresses. In the graph, X-axis shows the quantity demanded of ice cream and Y-axis shows the price. DD is the demand curve whereas the points A, B, C, D and E show the relationship between price and quantity demanded. When the price is Rs.50, the quantity demanded ice cream is 2 units. As price decreases to Rs.40, the quantity demanded increases to 4 units. Similarly, as the price reduces to Rs 30, 20 and 10, the quantity demanded ice cream increases to 6, 8 and 10 units respectively.
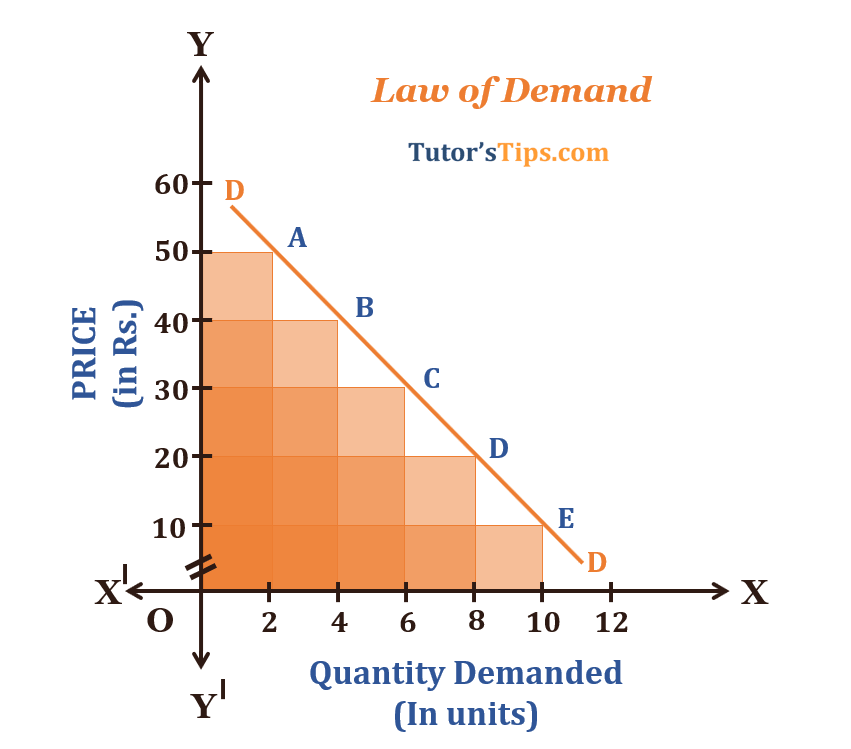
It clears that as the price of a commodity decreases, the quantity demanded of the same increases and vice versa, provided other things being constant. In short, we can say that the law of demand describes the behaviour of buyers as they buy more of a commodity at a lower price than at a higher price. When this inverse relationship between price and quantity demanded is graphed, the result is a demand curve.
Economics Educator
Mrs. Dilgeerjot Kaur holds a B.Com and M.Com degree and has over 9 years of teaching experience in microeconomics, macroeconomics, and business economics.
This guide covers "Law of Demand - Explained with Example", focusing on key definitions, step-by-step concepts, applications, and revision guidelines relevant to Economics Class 11.
It is primarily curated for Class 11 and Class 12 high school commerce, accounting, and economics students, as well as aspirants preparing for board exams or CA Foundation.
You can take our custom-built interactive practice quiz directly on this page to test your understanding of "Law of Demand - Explained with Example" instantly.