Advertisement
In Economics, the “movement along the supply curve” and “shift in supply curve” represent very different market situations. These two terms define the change in supply due to a change in its factors.
Advertisement
Meaning of Supply Curve :
Supply Curve is a graphical representation of the correlation between the price of the commodity and quantity supplied for a given period of time.
This curve is affected by the change in quantity supplied. The movement along the supply curve and shift in the supply curve explains the change in the supply. When the supply of a commodity change due to changes in its price, it is shown by movement along the supply curve and shift in the supply curve shows the change in quantity supplied due changes in factors of supply other than its price.
Movement along Supply Curve :
It refers to a change along the supply curve. On the supply curve, a movement expresses a change in both price and quantity supplied from one point to another on the curve. Therefore, it can be said that movement along the supply curve represents the variation in quantity supplied of a commodity with a change in its price, assuming other factors constant.
Advertisement-X
As we know, the quantity supplied of a commodity change in with increase or decrease in its on price while other factors of supply remain unchanged. When we show this change on a graph, it is known as movement along the supply curve.
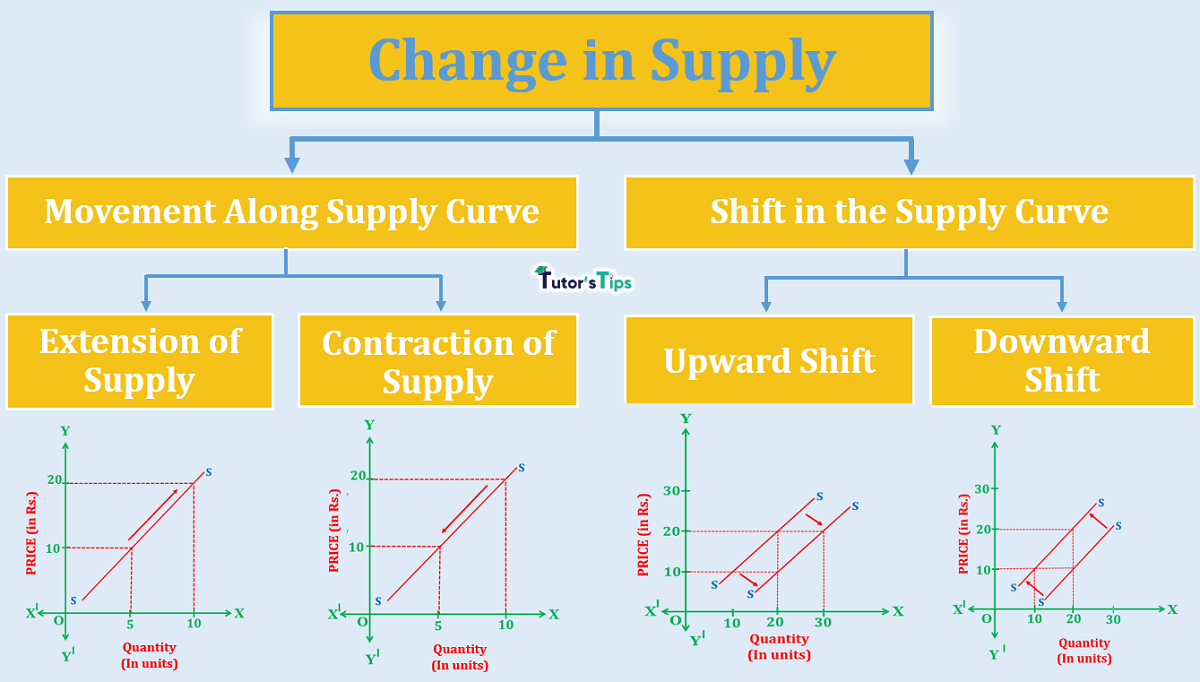
The movement along the supply curve can be classified as :
- Extension of Supply
- Contraction of Supply
Extension of Supply :
When the quantity supplied of a commodity increase with a rise in its price, it is known as an extension of supply, other things being equal.
This can be understood by the following illustration:
Suppose, the price of ice cream is Rs.10 and the quantity supplied is 5 units. When the price increases to Rs. 20, the supply extends to 10 units.
| Price of Ice Cream (in Rs.) | Quantity Supplied (in units) |
| 10 | 5 |
| 20 | 10 |
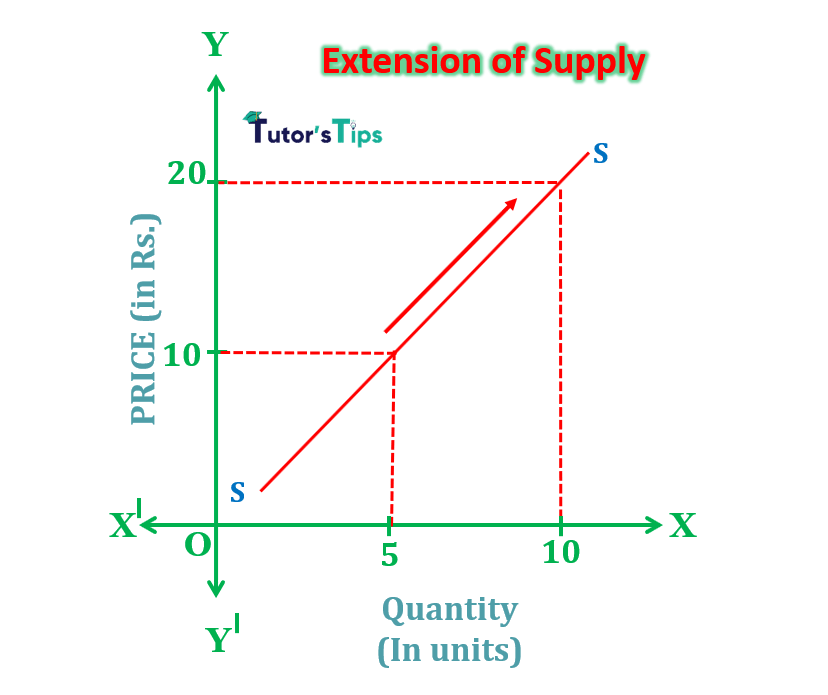
In Fig, X-axis shows the quantity and Y-axis shows the price. When the price is Rs10, the quantity supplied of ice cream is 5 units. As the price increases to Rs20, its supply also increases to 10 units. It implies the movement from a lower point to a higher point along the same supply curve, thus known as an extension of supply.
Contraction of Supply :
Advertisement-X
When the quantity supplied of a commodity decrease with a fall in its price, it is known as an extension of supply, other things being equal.
This can be understood by the following illustration:
Suppose, the price of ice cream is Rs.20 and the quantity supplied is 10 units. When the price increases to Rs. 10, the supply extends to 5 units.
| Price of Ice Cream (in Rs.) | Quantity Supplied (in units) |
| 20 | 10 |
| 10 | 5 |

In fig, X-axis shows the quantity of ice cream and Y-axis shows the price. When the price is Rs 20, the supply is 10 units. As price decreases to Rs10, its supply also falls to 5 units. It implies the movement from the upper point to a lower point on the same supply curve, thus called a contraction of supply.
Shift in Supply Curve :
When the supply of a commodity change due to changes in factors other than its price such as the price of related goods, cost of production, technology etc., the supply curve doesn’t extend or contract but shifts entirely. Then, it is known as the Shift in Supply Curve.
For example, the improvement in technology increases the production with low cost of production, which leads to more supply due to change in other factors of supply.
Advertisement-X
The shifts in the supply curve can be classified as :
- Upward Shift in Supply Curve
- Downward Shift in Supply Curve
Upward Shift in Supply Curve:
When the supply increases due to change in determinants of supply other than its price, it refers to an upward shift in the supply curve. Increase in supply implies two things :
a) Same Price More Supply:
When the supply of a commodity increase but its price remains the same, there is an upward shift in the supply curve.
For Example,
when the price a commodity is Rs20, the supply is 20 units. Keeping the price the same as Rs.20, if supply increases to 30 units. It denotes an upward shift in the supply curve.
| Price of Ice cream (in Rs) | Quantity Supplied(in units) |
| 20 | 20 |
| 20 | 30 |
b) Less Price Same Supply:
When the price of a commodity fall but its supply remains constant, there is an upward shift in the supply curve.
For Example,
when the price of a commodity is Rs 20, the supply is 20 units. If the price falls to Rs 10 and there is no change in the supply, it denotes an upward shift in the supply curve.
| Price of Ice cream (in Rs) | Quantity Supplied(in units) |
| 20 | 20 |
| 10 | 20 |

Advertisement-X
Advertisement-Y
In fig, X-axis shows the quantity of ice cream and Y-axis shows the price. SS is the supply curve. At price Rs 20, the supply is 20 units. When there is an increase in supply due to change in factors other than its price, the supply curve shifts downwards to the right in two ways :
i) If supply increases from 20 units to 30 units.
ii) Price of ice cream declines to Rs.10 but supply remains the same as 20 units.
This shift of the supply curve is known as an upward shift.
Reasons for an upward shift in the supply curve :
a) Improvement in Technology
b)Reduction in the prices of factors of production causing a fall in the cost of production.
Advertisement-X
c) When the price of related goods decreases.
d)Increase in the number of firms in the market.
e) When the firms expect a fall in the price of commodity near future.
f) When the motive of the firm shifts from profit maximization to sales maximization.
g) The decrease in taxations or grant of subsidies.
Downward Shift in Supply Curve :
When the supply increases due to change in determinants of supply other than its price, it refers to an upward shift in the supply curve. Increase in supply implies two things :
a) Same Price Less Supply:
Advertisement-X
When the supply of a commodity decrease but its price remains the same, there is a downward shift in the supply curve.
For Example,
when the price a commodity is Rs10, the supply is 20 units. Keeping the price the same as Rs.10, if supply increases to 10 units. It denotes a downward shift in the supply curve.
| Price of Ice cream (in Rs) | Quantity Supplied(in units) |
| 10 | 20 |
| 10 | 10 |
b) More Price Same Supply:
When the price of a commodity rise but its supply remains constant, there is an upward shift in the supply curve.
For Example,
when the price of a commodity is Rs 10, the supply is 20 units. If the price falls to Rs 20 and there is no change in the supply, it denotes an upward shift in the supply curve.
| Price of Ice cream (in Rs) | Quantity Supplied(in units) |
| 10 | 20 |
| 20 | 20 |
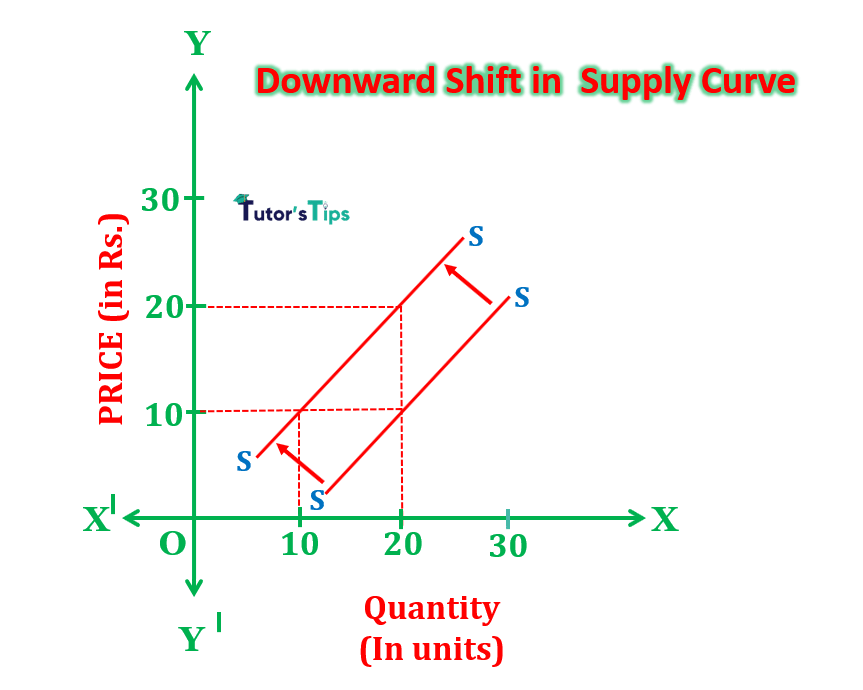
In fig, X-axis shows the quantity and Y-axis shows the price. At price Rs10, the supply is 20 units. When there is a change in any factors of supply other than own price, supply decreases and supply curve shifts to upwards to left by two ways. The new supply curve implies two things :
i)New supply curve indicates that at the same price Rs.10, the new supply has fallen to 10 units of ice cream.
Advertisement-X
ii)It also means that at a higher price of Rs20, the supply remains 20 units of ice cream.
Thus, the supply curve represents a decrease in supply.
Reasons for a downward shift in the supply curve :
a) When technology becomes obsolete resulting in the high cost of production.
b)Rise in the prices of factors of production causing an increase in the cost of production.
c) When the price of related goods increases.
d) A decrease in the number of firms in the market.
Advertisement-X
e) When the firms expect a rise in the price of commodity near future.
f) When the motive of the firm shifts from sales maximization to profit maximization.
g) The increase in taxations or withdrawal of subsidies.
Thanks!!!
Please share with your friends
Comment if you have any question.
Advertisement-X
References:
Introductory Microeconomics – Class 11 – CBSE (2020-21)